| __timestamp | Autodesk, Inc. | Block, Inc. |
|---|---|---|
| Wednesday, January 1, 2014 | 1999600000 | 226074000 |
| Thursday, January 1, 2015 | 2170100000 | 370030000 |
| Friday, January 1, 2016 | 2133400000 | 576038000 |
| Sunday, January 1, 2017 | 1689100000 | 839306000 |
| Monday, January 1, 2018 | 1753200000 | 1303700000 |
| Tuesday, January 1, 2019 | 2283900000 | 1889685000 |
| Wednesday, January 1, 2020 | 2949400000 | 2733409000 |
| Friday, January 1, 2021 | 3453300000 | 4419823000 |
| Saturday, January 1, 2022 | 3967900000 | 5991892000 |
| Sunday, January 1, 2023 | 4525000000 | 7504886000 |
| Monday, January 1, 2024 | 4977000000 |
Unlocking the unknown
In the ever-evolving landscape of technology and finance, understanding the financial health of industry giants is crucial. This analysis delves into the gross profit trends of Autodesk, Inc. and Block, Inc. from 2014 to 2023. Over this period, Autodesk's gross profit surged by approximately 146%, reflecting its robust growth and market adaptation. In contrast, Block, Inc. exhibited an impressive 3,220% increase, showcasing its rapid expansion and innovation in the fintech sector.
While 2024 data for Block, Inc. remains unavailable, these trends offer a compelling narrative of two companies navigating their respective industries with distinct strategies.
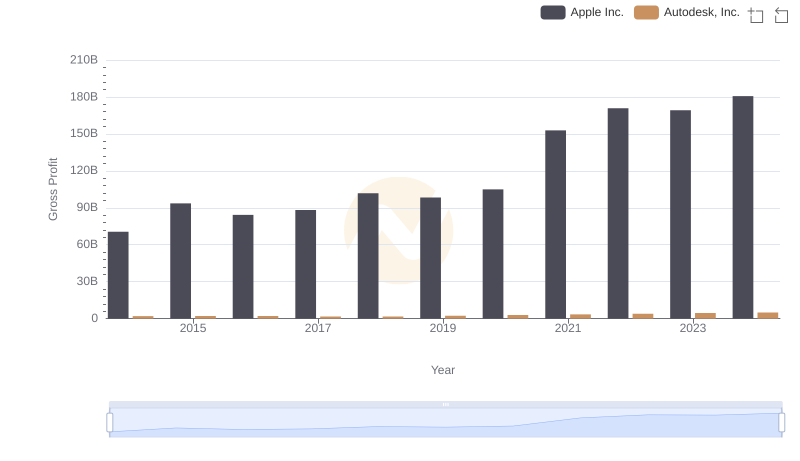
Apple Inc. vs Autodesk, Inc.: A Gross Profit Performance Breakdown
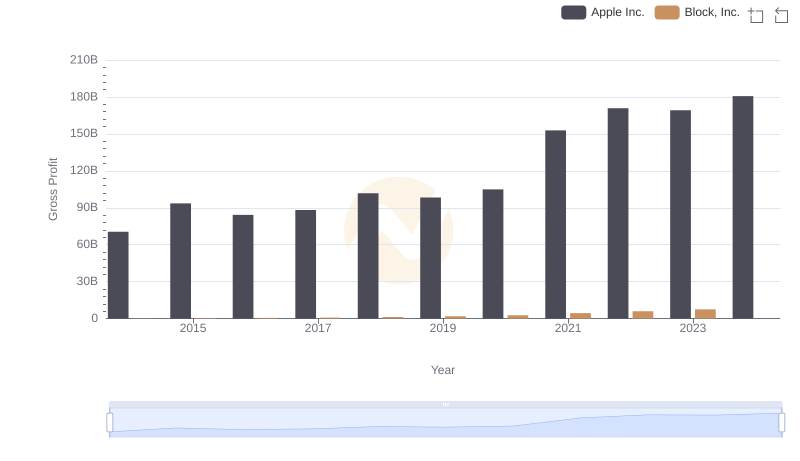
Gross Profit Trends Compared: Apple Inc. vs Block, Inc.
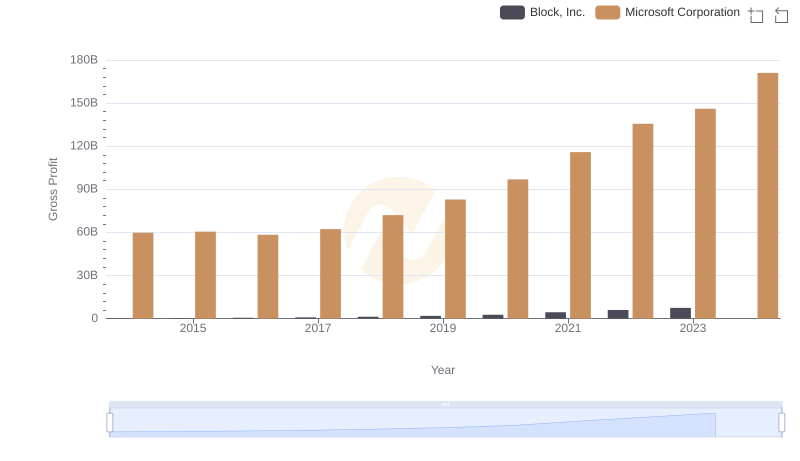
Microsoft Corporation and Block, Inc.: A Detailed Gross Profit Analysis
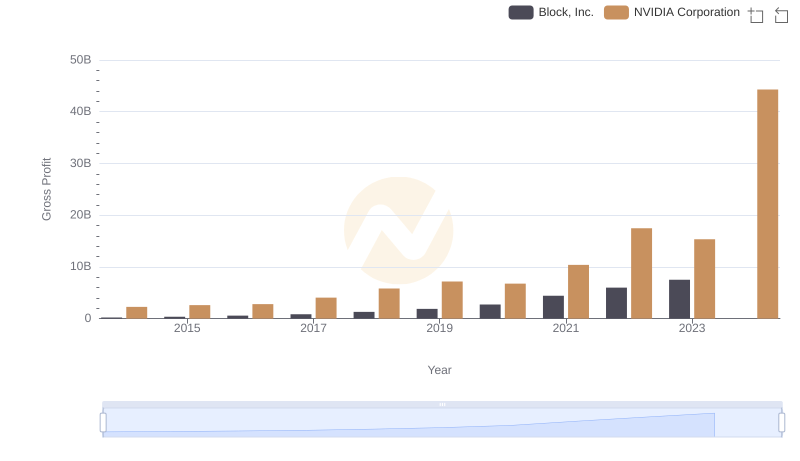
Gross Profit Analysis: Comparing NVIDIA Corporation and Block, Inc.
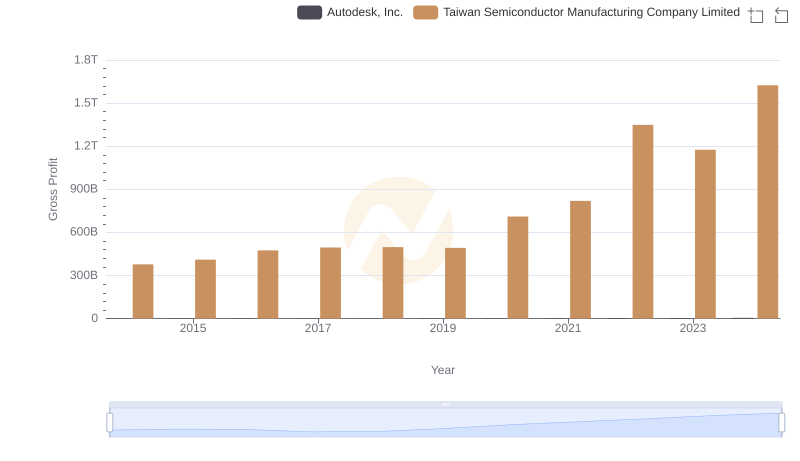
Key Insights on Gross Profit: Taiwan Semiconductor Manufacturing Company Limited vs Autodesk, Inc.
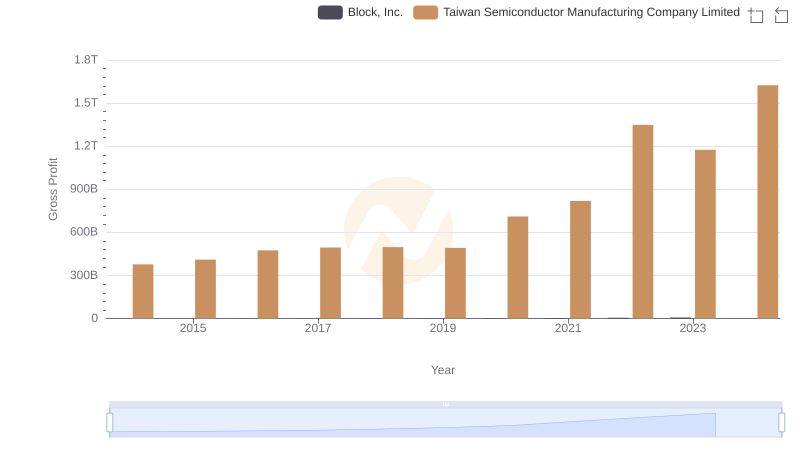
Taiwan Semiconductor Manufacturing Company Limited and Block, Inc.: A Detailed Gross Profit Analysis
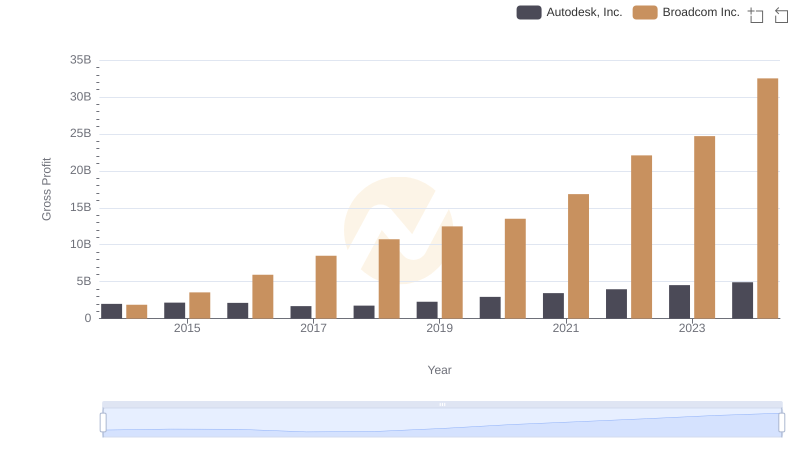
Key Insights on Gross Profit: Broadcom Inc. vs Autodesk, Inc.
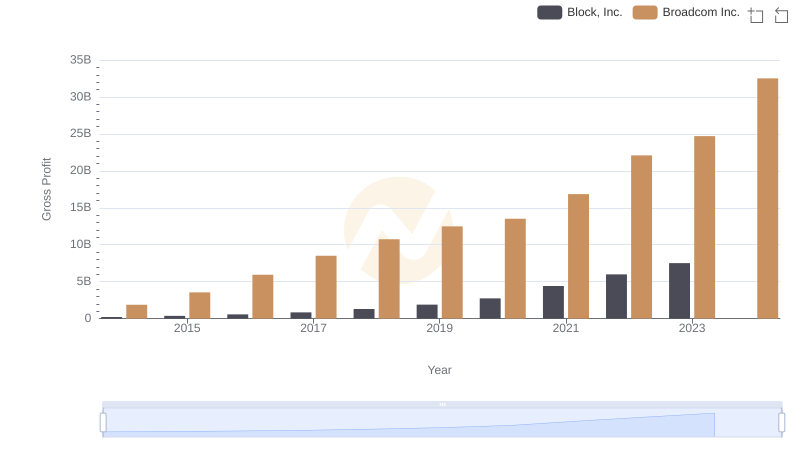
Gross Profit Comparison: Broadcom Inc. and Block, Inc. Trends
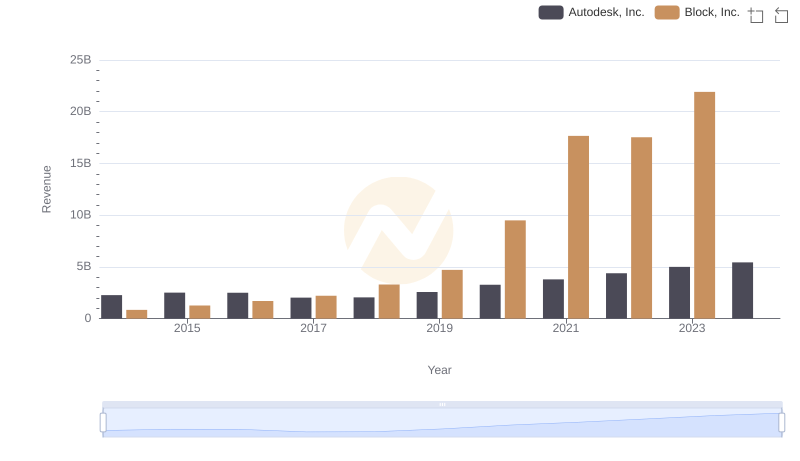
Revenue Insights: Autodesk, Inc. and Block, Inc. Performance Compared

Comparing Cost of Revenue Efficiency: Autodesk, Inc. vs Block, Inc.
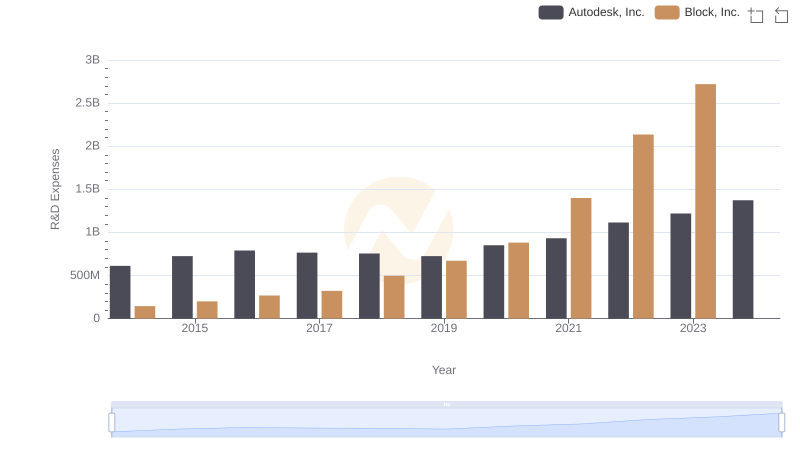
Research and Development Investment: Autodesk, Inc. vs Block, Inc.
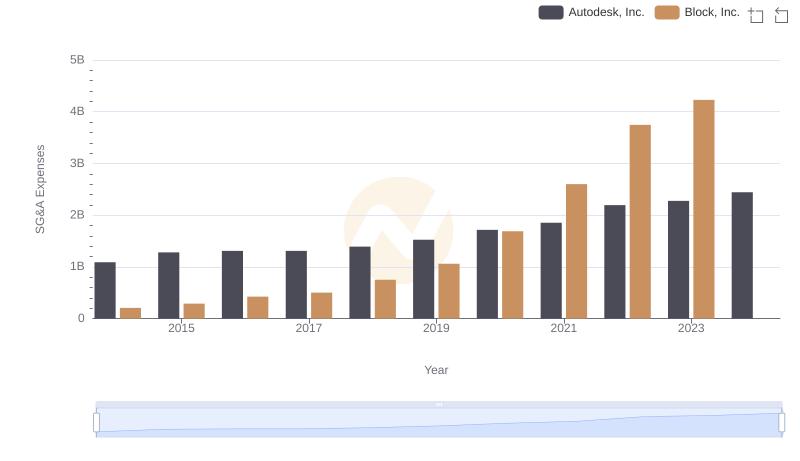
Operational Costs Compared: SG&A Analysis of Autodesk, Inc. and Block, Inc.