| __timestamp | Autodesk, Inc. | Block, Inc. |
|---|---|---|
| Wednesday, January 1, 2014 | 274300000 | 624118000 |
| Thursday, January 1, 2015 | 342100000 | 897088000 |
| Friday, January 1, 2016 | 370700000 | 1132683000 |
| Sunday, January 1, 2017 | 341900000 | 1374947000 |
| Monday, January 1, 2018 | 303400000 | 1994477000 |
| Tuesday, January 1, 2019 | 285900000 | 2823815000 |
| Wednesday, January 1, 2020 | 324900000 | 6764169000 |
| Friday, January 1, 2021 | 337100000 | 13241380000 |
| Saturday, January 1, 2022 | 418500000 | 11539695000 |
| Sunday, January 1, 2023 | 480000000 | 14410737000 |
| Monday, January 1, 2024 | 463000000 |
Igniting the spark of knowledge
In the ever-evolving landscape of technology, understanding cost efficiency is crucial. Autodesk, Inc. and Block, Inc. have been pivotal players, each with unique trajectories. From 2014 to 2023, Autodesk's cost of revenue grew by approximately 86%, reflecting its strategic investments in software development. In contrast, Block, Inc. experienced a staggering increase of over 2,200% in the same period, highlighting its aggressive expansion in the fintech sector.
Autodesk maintained a steady growth, with costs peaking at $511 million in 2024, while Block's costs soared to $14.4 billion by 2023, before data became unavailable for 2024. This comparison underscores the diverse strategies of these companies: Autodesk's focus on sustainable growth versus Block's rapid scaling. As we look to the future, these trends offer valuable insights into the financial strategies shaping the tech industry.
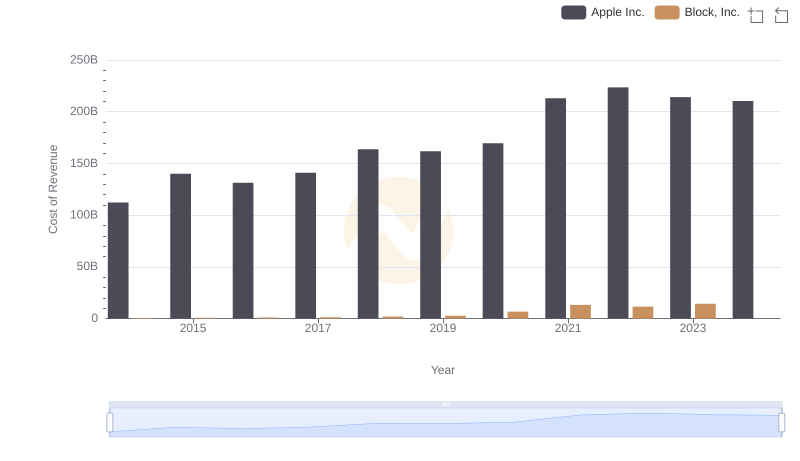
Cost of Revenue: Key Insights for Apple Inc. and Block, Inc.
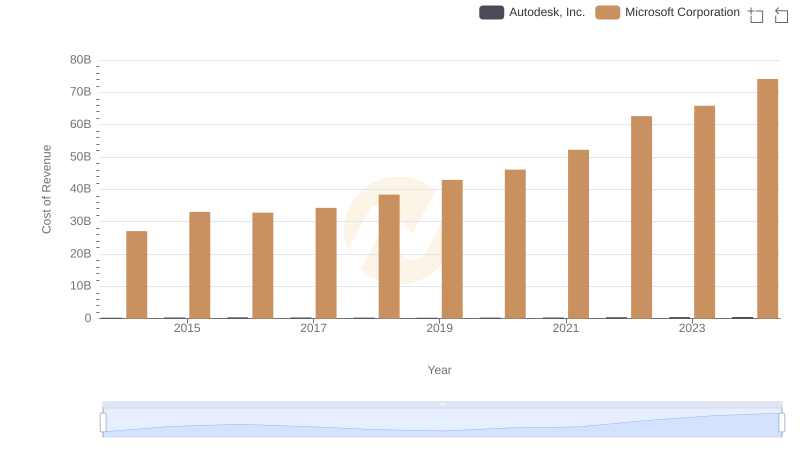
Cost Insights: Breaking Down Microsoft Corporation and Autodesk, Inc.'s Expenses
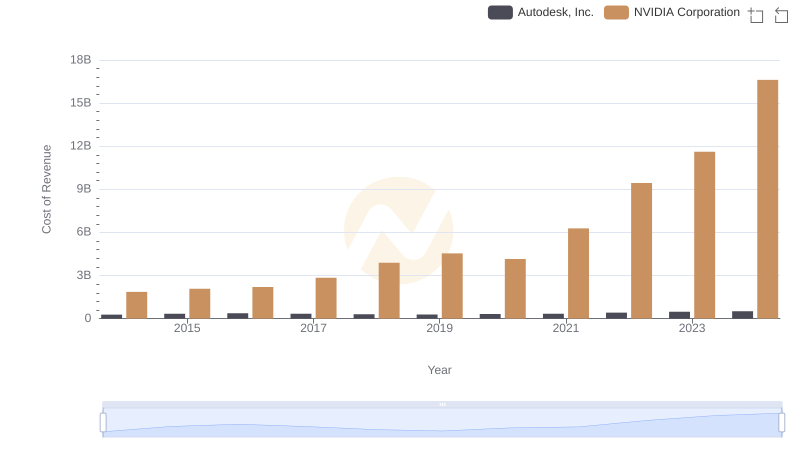
Cost of Revenue Comparison: NVIDIA Corporation vs Autodesk, Inc.
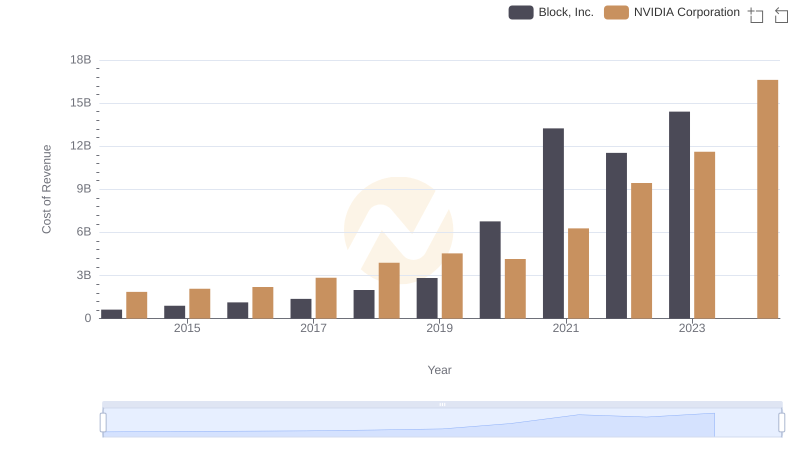
Cost of Revenue Comparison: NVIDIA Corporation vs Block, Inc.
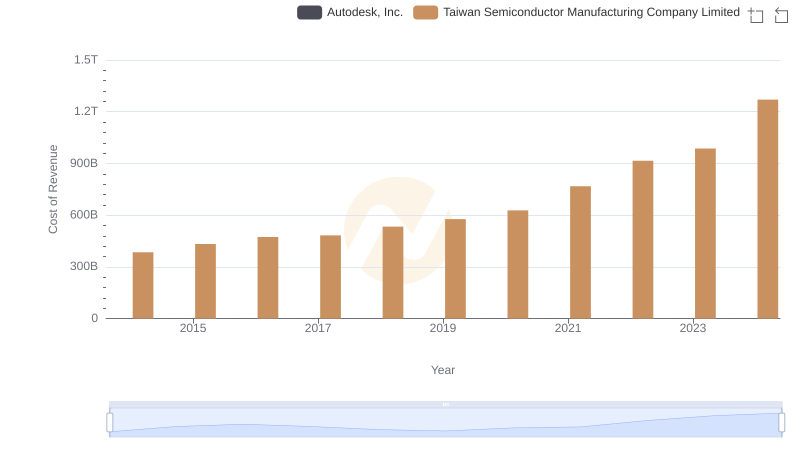
Cost of Revenue: Key Insights for Taiwan Semiconductor Manufacturing Company Limited and Autodesk, Inc.
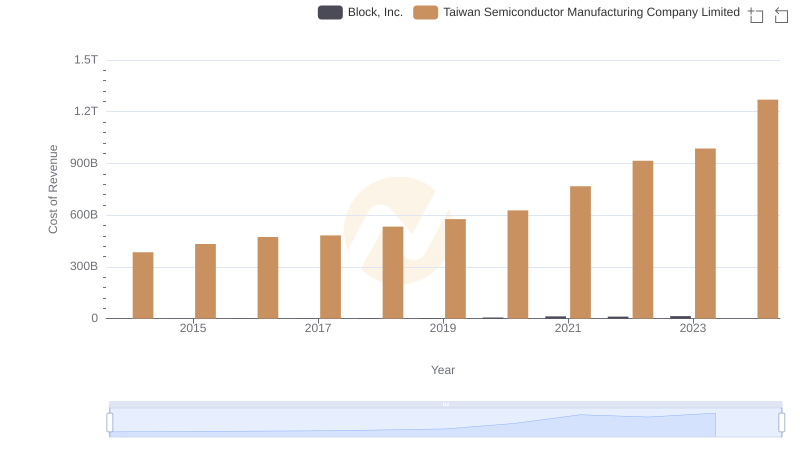
Comparing Cost of Revenue Efficiency: Taiwan Semiconductor Manufacturing Company Limited vs Block, Inc.
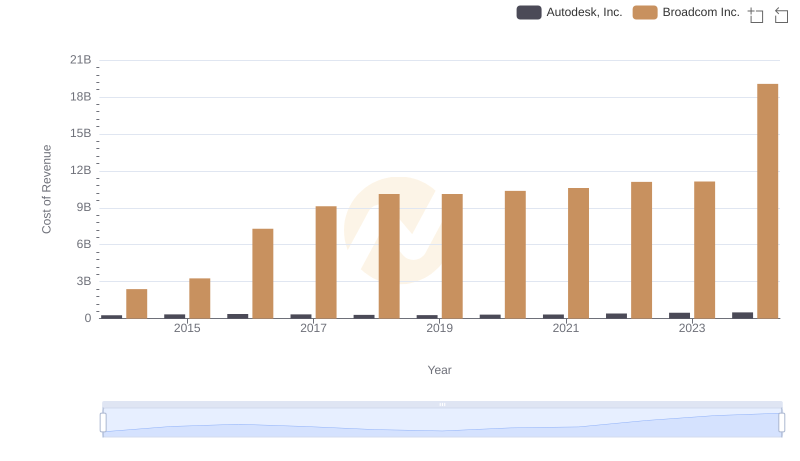
Cost of Revenue: Key Insights for Broadcom Inc. and Autodesk, Inc.
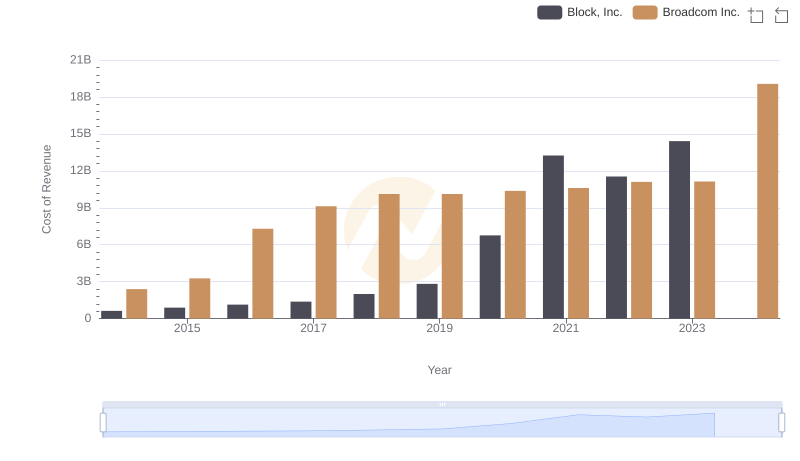
Comparing Cost of Revenue Efficiency: Broadcom Inc. vs Block, Inc.
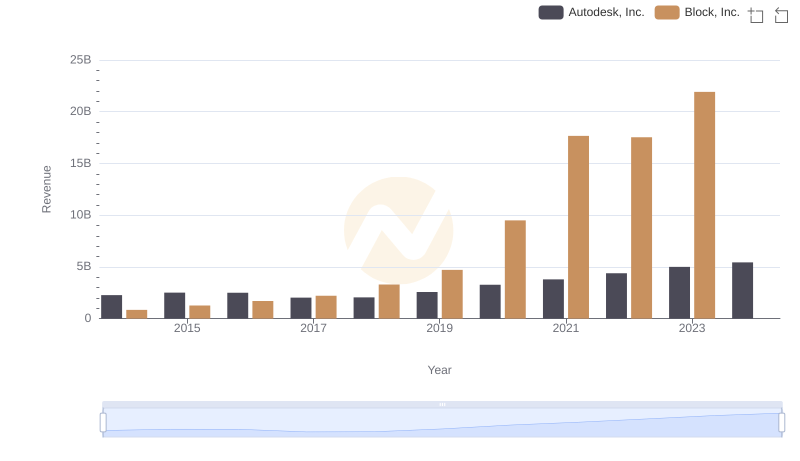
Revenue Insights: Autodesk, Inc. and Block, Inc. Performance Compared
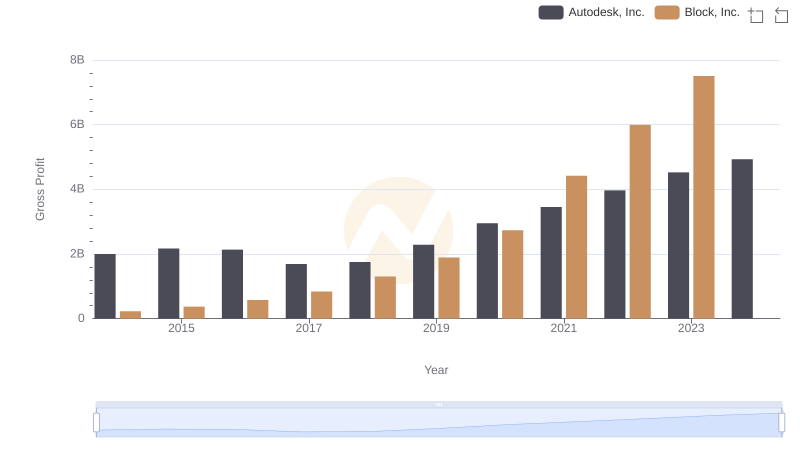
Gross Profit Comparison: Autodesk, Inc. and Block, Inc. Trends
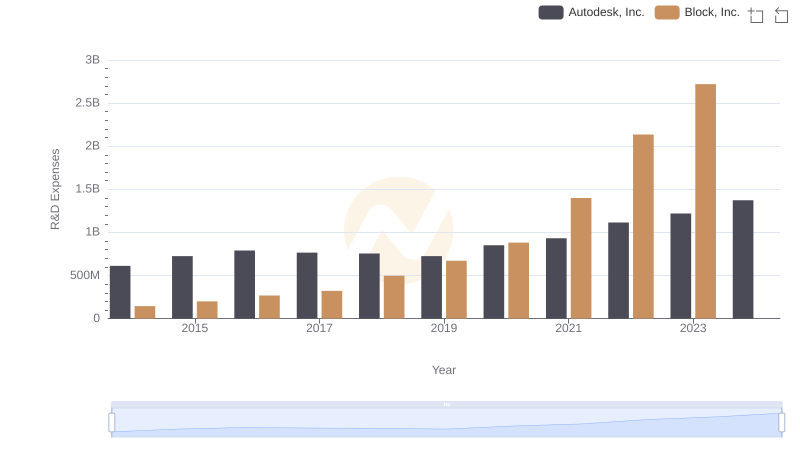
Research and Development Investment: Autodesk, Inc. vs Block, Inc.
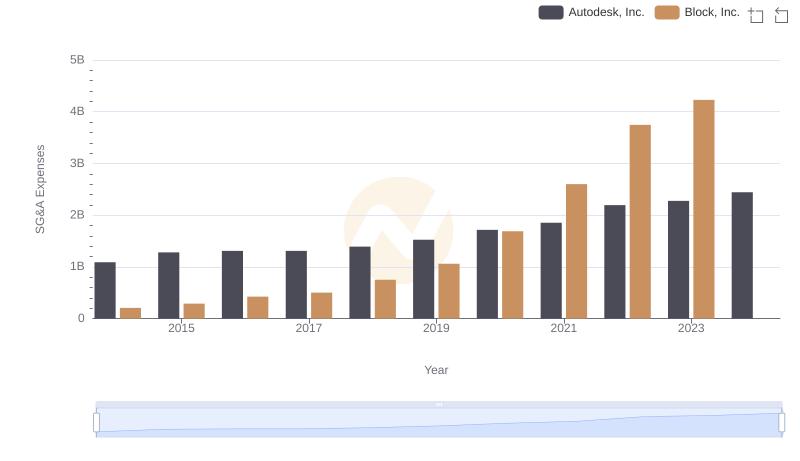
Operational Costs Compared: SG&A Analysis of Autodesk, Inc. and Block, Inc.