| __timestamp | FLEETCOR Technologies, Inc. | Workday, Inc. |
|---|---|---|
| Wednesday, January 1, 2014 | 1026053000 | 292128000 |
| Thursday, January 1, 2015 | 1371792000 | 523057000 |
| Friday, January 1, 2016 | 1476132000 | 787919000 |
| Sunday, January 1, 2017 | 1819925000 | 1085862000 |
| Monday, January 1, 2018 | 1945797000 | 1513637000 |
| Tuesday, January 1, 2019 | 2118179000 | 1987230000 |
| Wednesday, January 1, 2020 | 1792492000 | 2561948000 |
| Friday, January 1, 2021 | 2273917000 | 3119864000 |
| Saturday, January 1, 2022 | 2662422000 | 3710703000 |
| Sunday, January 1, 2023 | 2727580001 | 4500640000 |
| Monday, January 1, 2024 | 3974589000 | 5488000000 |
In pursuit of knowledge
In the ever-evolving landscape of technology and financial services, Workday, Inc. and FLEETCOR Technologies, Inc. have showcased intriguing gross profit trajectories over the past decade. Since 2014, Workday has experienced a remarkable growth, with its gross profit surging by over 1,700%, reaching approximately $4.5 billion by 2023. This growth underscores Workday's robust expansion in the cloud-based enterprise software market.
Conversely, FLEETCOR Technologies, a leader in specialized payment products, has seen a steady increase of around 166% in its gross profit, peaking at nearly $2.7 billion in 2023. This consistent growth reflects FLEETCOR's strategic acquisitions and expansion in the global payments sector.
While Workday's trajectory is marked by rapid acceleration, FLEETCOR's path is characterized by steady, reliable growth. The data for 2024 is incomplete, leaving room for speculation on future trends.
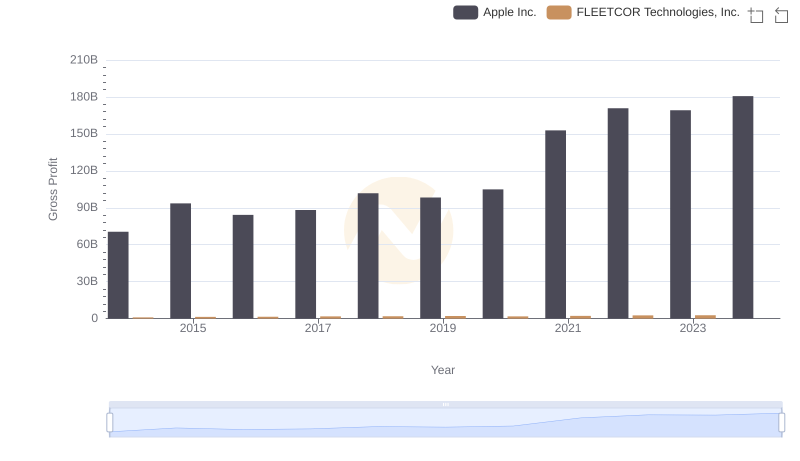
Apple Inc. and FLEETCOR Technologies, Inc.: A Detailed Gross Profit Analysis
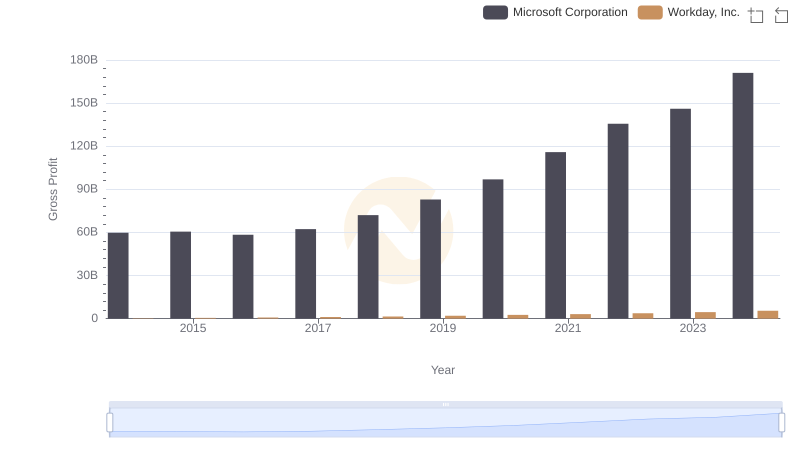
Gross Profit Trends Compared: Microsoft Corporation vs Workday, Inc.
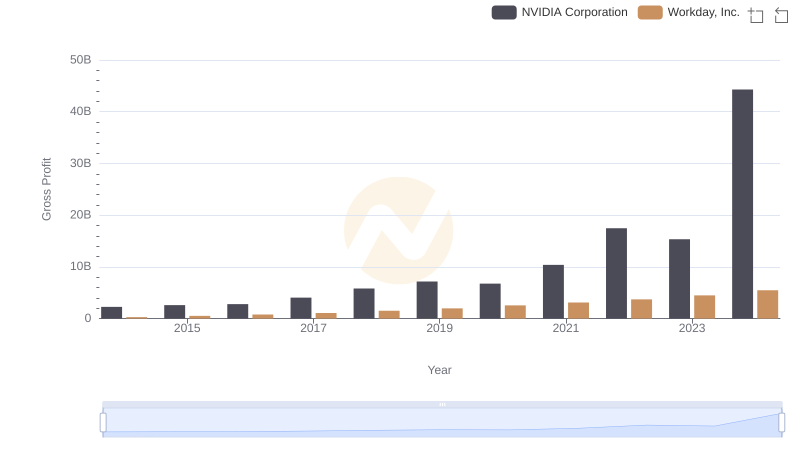
Gross Profit Analysis: Comparing NVIDIA Corporation and Workday, Inc.
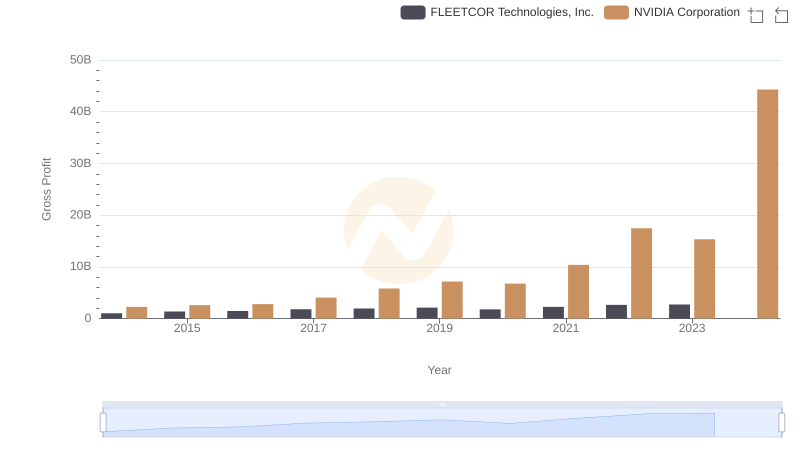
Key Insights on Gross Profit: NVIDIA Corporation vs FLEETCOR Technologies, Inc.
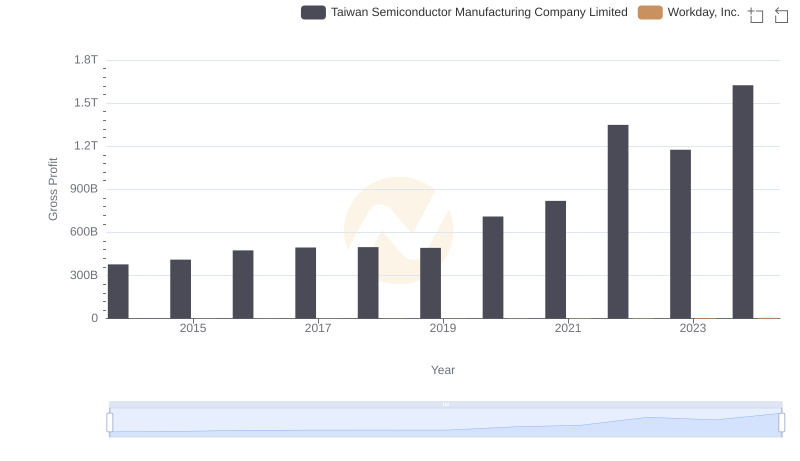
Who Generates Higher Gross Profit? Taiwan Semiconductor Manufacturing Company Limited or Workday, Inc.
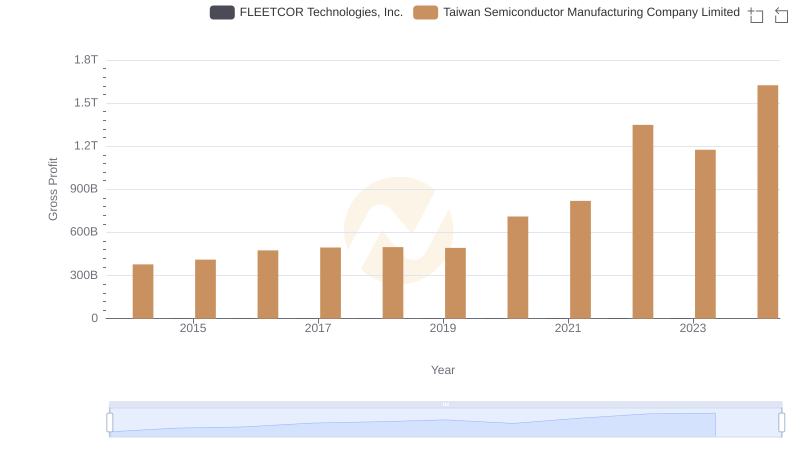
Gross Profit Comparison: Taiwan Semiconductor Manufacturing Company Limited and FLEETCOR Technologies, Inc. Trends
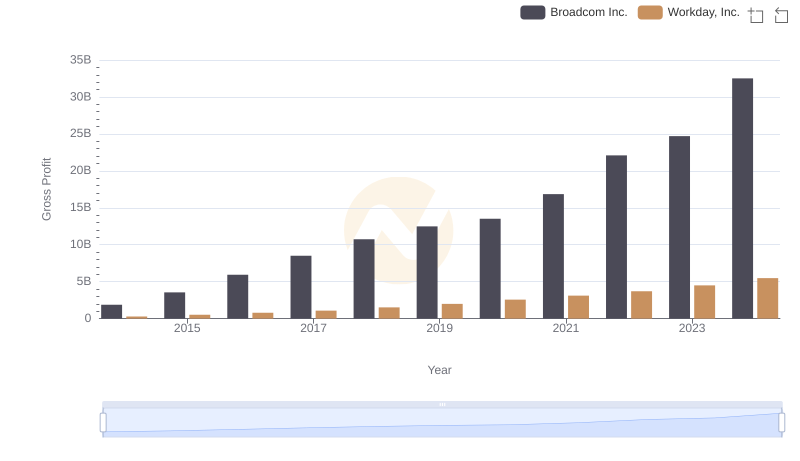
Key Insights on Gross Profit: Broadcom Inc. vs Workday, Inc.
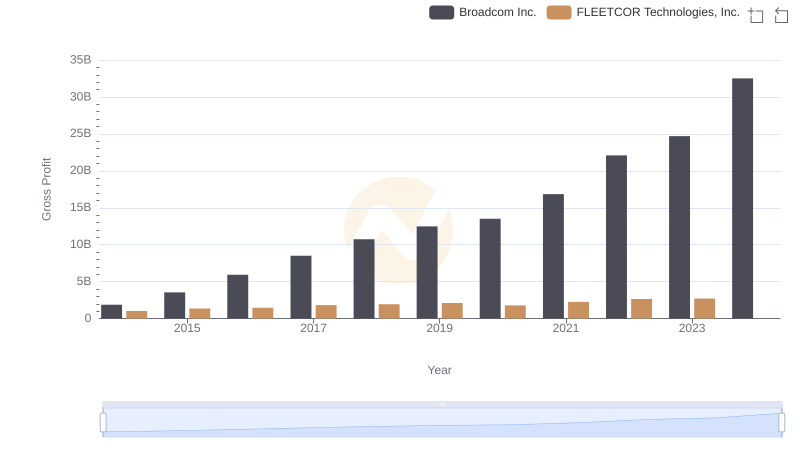
Gross Profit Analysis: Comparing Broadcom Inc. and FLEETCOR Technologies, Inc.
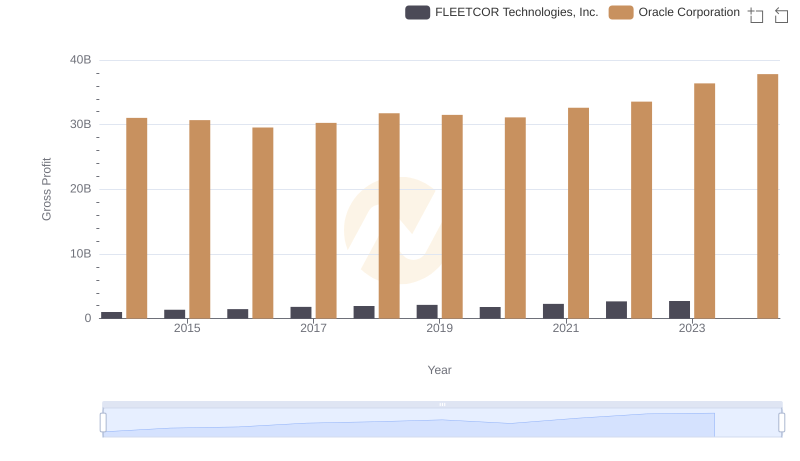
Oracle Corporation and FLEETCOR Technologies, Inc.: A Detailed Gross Profit Analysis
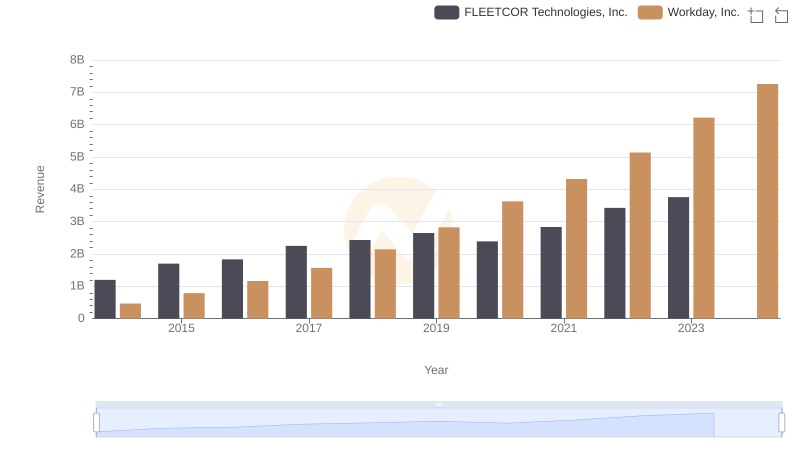
Comparing Revenue Performance: Workday, Inc. or FLEETCOR Technologies, Inc.?
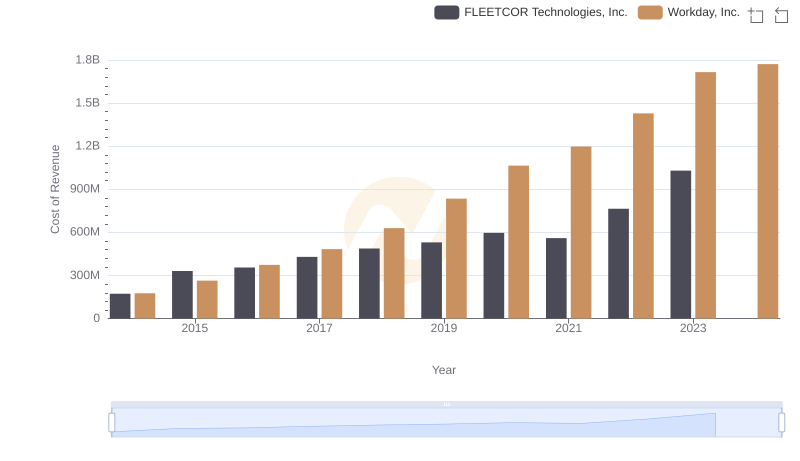
Cost of Revenue Comparison: Workday, Inc. vs FLEETCOR Technologies, Inc.
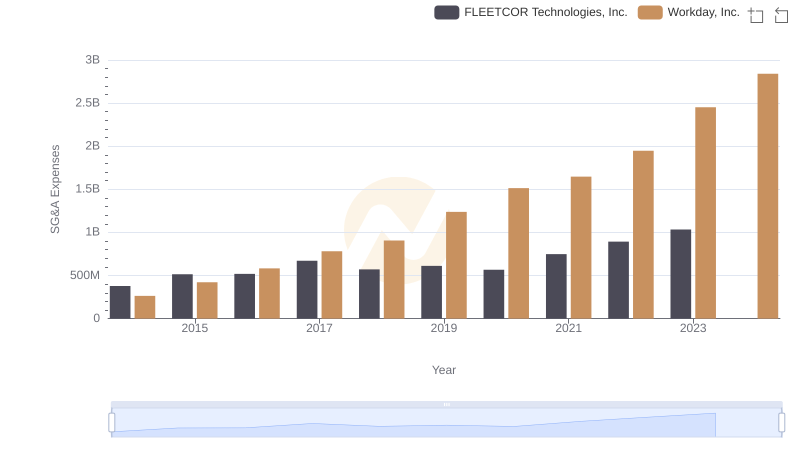
Comparing SG&A Expenses: Workday, Inc. vs FLEETCOR Technologies, Inc. Trends and Insights