| __timestamp | FLEETCOR Technologies, Inc. | Workday, Inc. |
|---|---|---|
| Wednesday, January 1, 2014 | 173337000 | 176810000 |
| Thursday, January 1, 2015 | 331073000 | 264803000 |
| Friday, January 1, 2016 | 355414000 | 374427000 |
| Sunday, January 1, 2017 | 429613000 | 483545000 |
| Monday, January 1, 2018 | 487695000 | 629413000 |
| Tuesday, January 1, 2019 | 530669000 | 834950000 |
| Wednesday, January 1, 2020 | 596363000 | 1065258000 |
| Friday, January 1, 2021 | 559819000 | 1198132000 |
| Saturday, January 1, 2022 | 764707000 | 1428095000 |
| Sunday, January 1, 2023 | 1030138999 | 1715178000 |
| Monday, January 1, 2024 | 0 | 1771000000 |
Data in motion
In the ever-evolving landscape of technology and financial services, Workday, Inc. and FLEETCOR Technologies, Inc. have emerged as significant players. Over the past decade, Workday has consistently outpaced FLEETCOR in terms of cost of revenue, showcasing a robust growth trajectory. From 2014 to 2023, Workday's cost of revenue surged by approximately 870%, reflecting its aggressive expansion and investment in cloud-based solutions. In contrast, FLEETCOR's cost of revenue increased by around 495% during the same period, indicating steady growth in its financial services offerings.
The data reveals a consistent upward trend for both companies, with Workday reaching a peak in 2023, while FLEETCOR's highest recorded cost of revenue was in 2023. Notably, Workday's figures for 2024 are projected, highlighting its continued growth momentum. This comparison underscores the dynamic nature of these industries and the strategic decisions driving these companies forward.
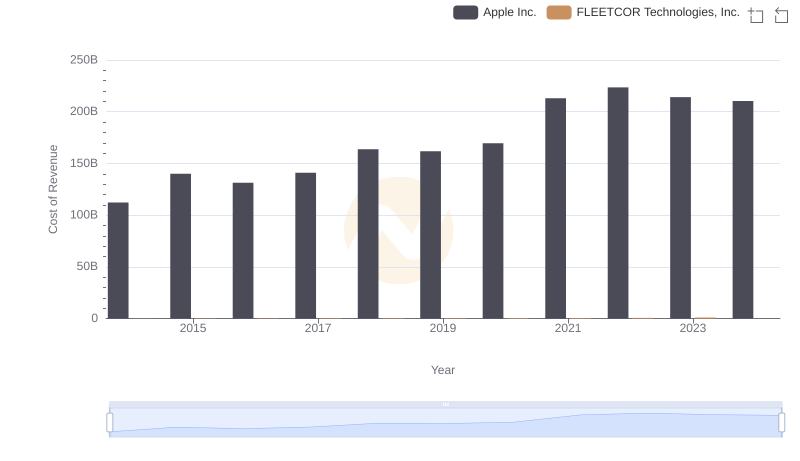
Apple Inc. vs FLEETCOR Technologies, Inc.: Efficiency in Cost of Revenue Explored
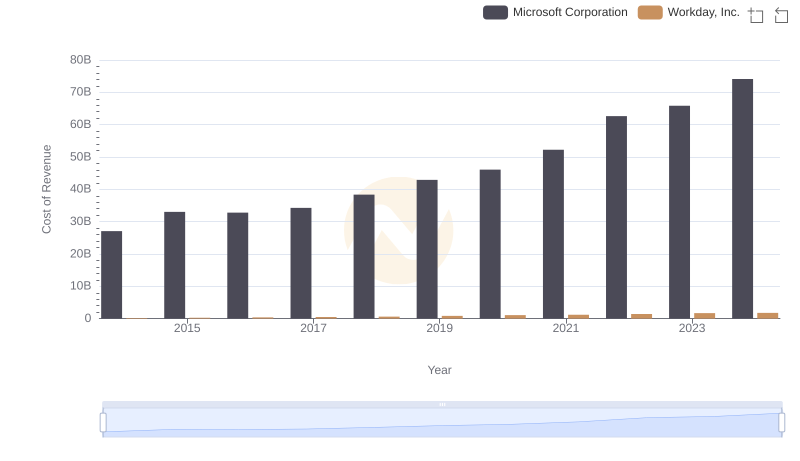
Comparing Cost of Revenue Efficiency: Microsoft Corporation vs Workday, Inc.
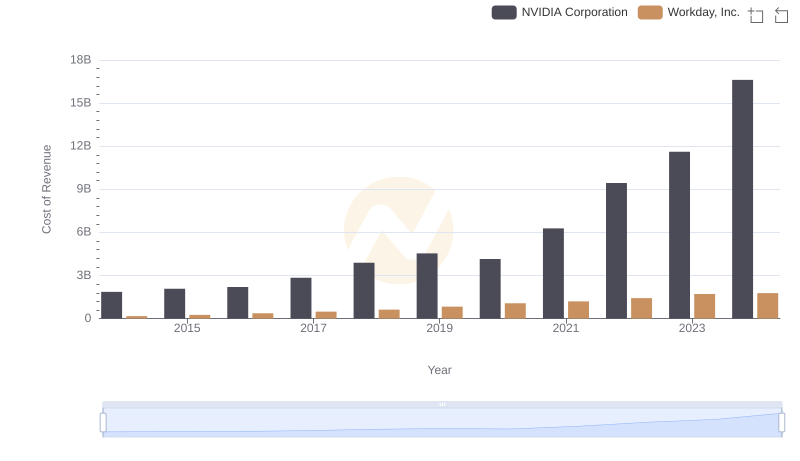
Cost of Revenue: Key Insights for NVIDIA Corporation and Workday, Inc.
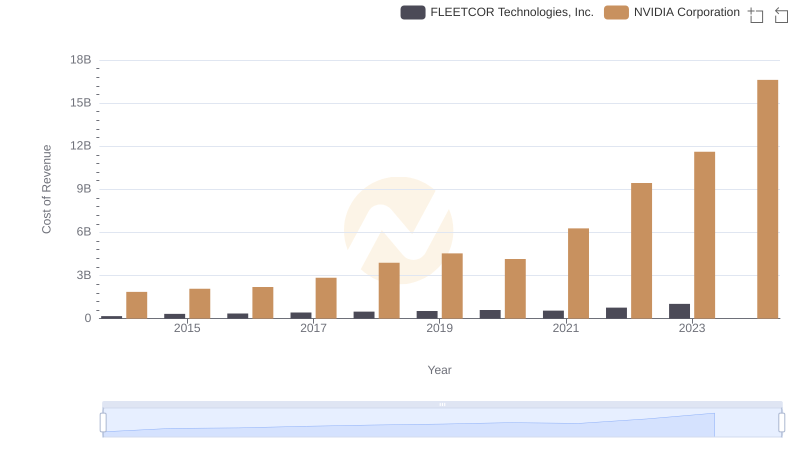
Cost Insights: Breaking Down NVIDIA Corporation and FLEETCOR Technologies, Inc.'s Expenses
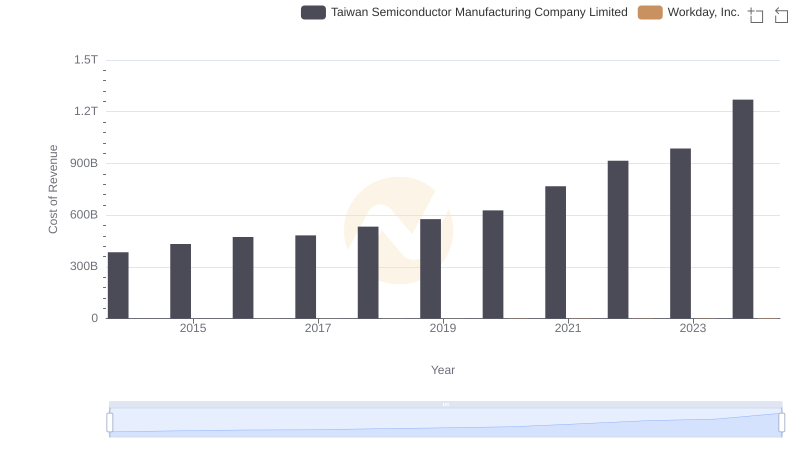
Cost of Revenue Trends: Taiwan Semiconductor Manufacturing Company Limited vs Workday, Inc.
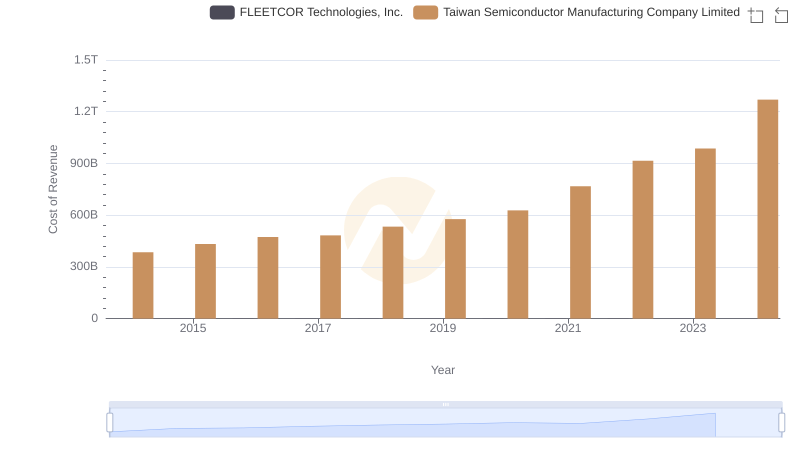
Cost of Revenue Comparison: Taiwan Semiconductor Manufacturing Company Limited vs FLEETCOR Technologies, Inc.
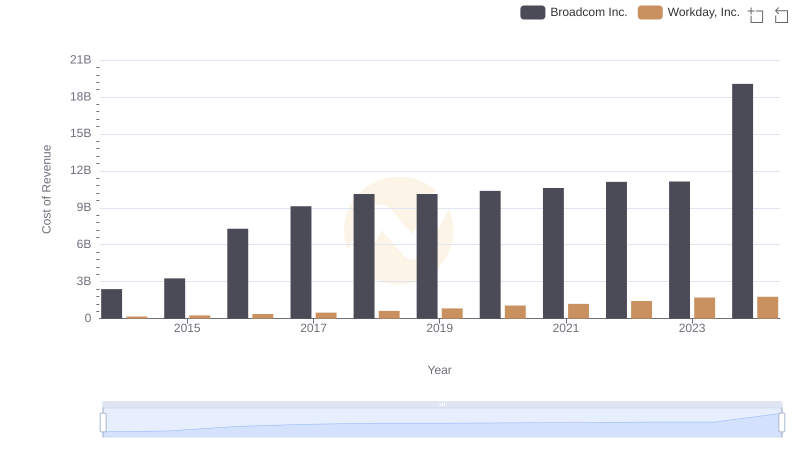
Cost Insights: Breaking Down Broadcom Inc. and Workday, Inc.'s Expenses
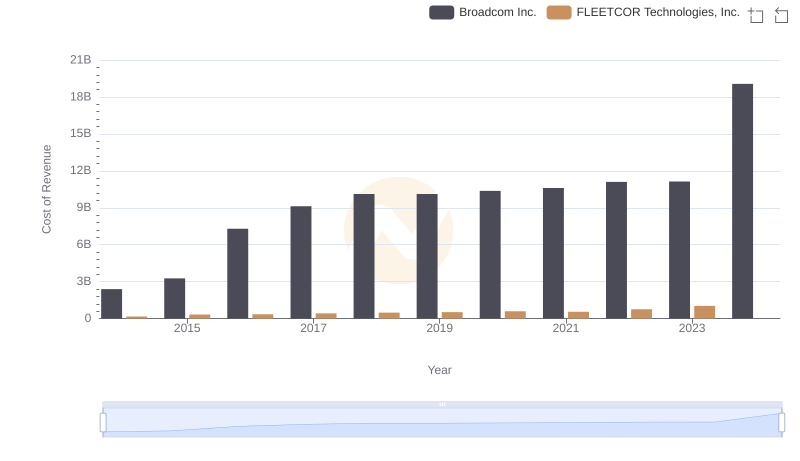
Broadcom Inc. vs FLEETCOR Technologies, Inc.: Efficiency in Cost of Revenue Explored
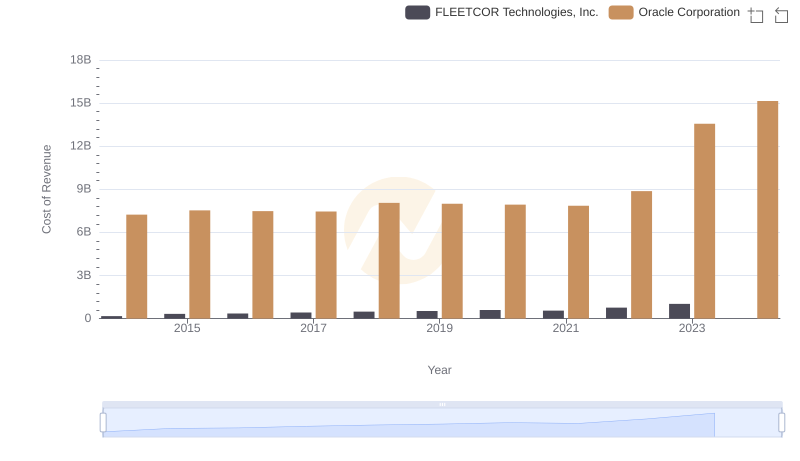
Analyzing Cost of Revenue: Oracle Corporation and FLEETCOR Technologies, Inc.
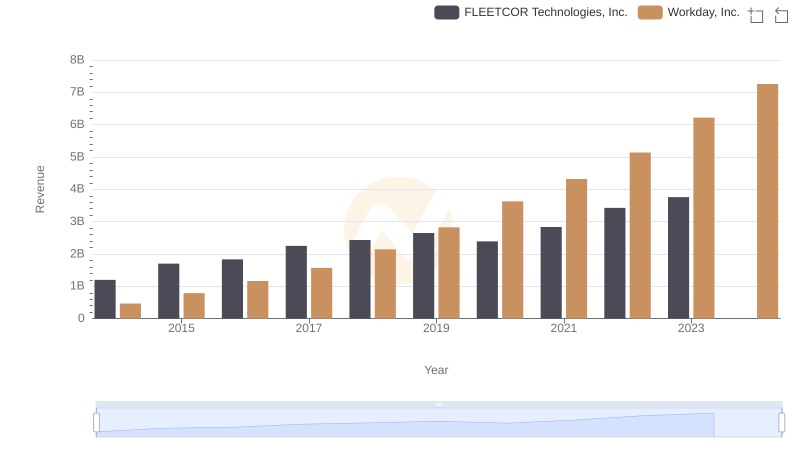
Comparing Revenue Performance: Workday, Inc. or FLEETCOR Technologies, Inc.?
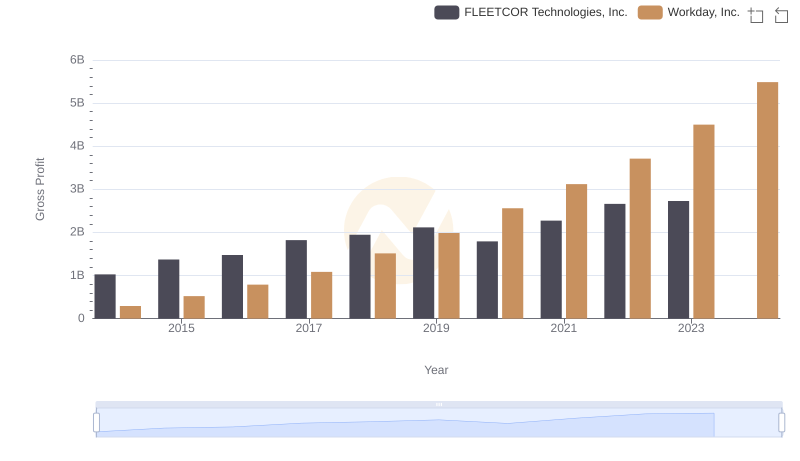
Gross Profit Trends Compared: Workday, Inc. vs FLEETCOR Technologies, Inc.
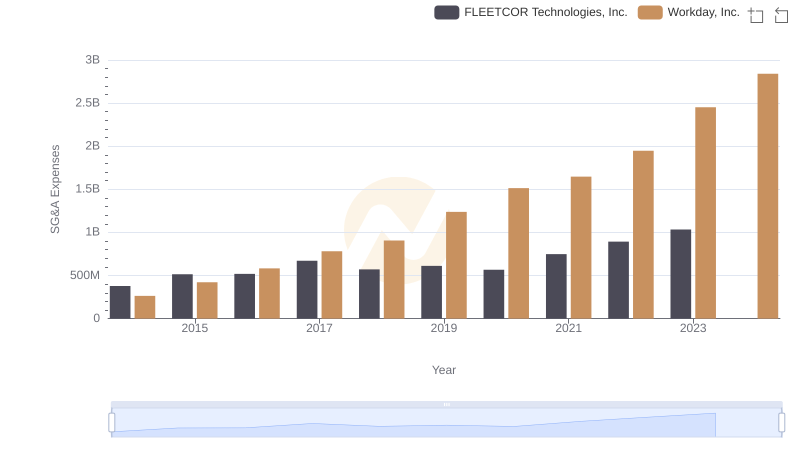
Comparing SG&A Expenses: Workday, Inc. vs FLEETCOR Technologies, Inc. Trends and Insights