| __timestamp | FLEETCOR Technologies, Inc. | Workday, Inc. |
|---|---|---|
| Wednesday, January 1, 2014 | 377744000 | 263294000 |
| Thursday, January 1, 2015 | 515047000 | 421891000 |
| Friday, January 1, 2016 | 519413000 | 582634000 |
| Sunday, January 1, 2017 | 671544000 | 781996000 |
| Monday, January 1, 2018 | 571765000 | 906276000 |
| Tuesday, January 1, 2019 | 612016000 | 1238682000 |
| Wednesday, January 1, 2020 | 567410000 | 1514272000 |
| Friday, January 1, 2021 | 747948000 | 1647241000 |
| Saturday, January 1, 2022 | 893217000 | 1947933000 |
| Sunday, January 1, 2023 | 1034248000 | 2452180000 |
| Monday, January 1, 2024 | 997780000 | 2841000000 |
Igniting the spark of knowledge
In the ever-evolving landscape of corporate finance, understanding the trends in Selling, General, and Administrative (SG&A) expenses is crucial. This chart offers a fascinating glimpse into the financial strategies of two industry giants: Workday, Inc. and FLEETCOR Technologies, Inc., from 2014 to 2023.
Workday, Inc. has shown a remarkable upward trajectory in its SG&A expenses, growing nearly tenfold over the decade. By 2023, Workday's expenses reached approximately 2.45 billion, reflecting its aggressive expansion and investment in growth.
In contrast, FLEETCOR Technologies, Inc. has maintained a more stable growth pattern, with its SG&A expenses increasing by about 174% over the same period. This steady rise indicates a more conservative financial strategy, focusing on sustainable growth.
The data for 2024 is incomplete, highlighting the dynamic nature of financial forecasting.
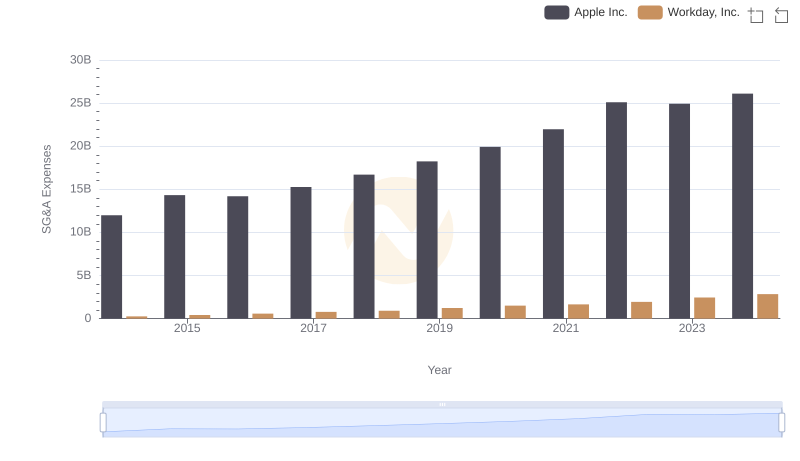
SG&A Efficiency Analysis: Comparing Apple Inc. and Workday, Inc.
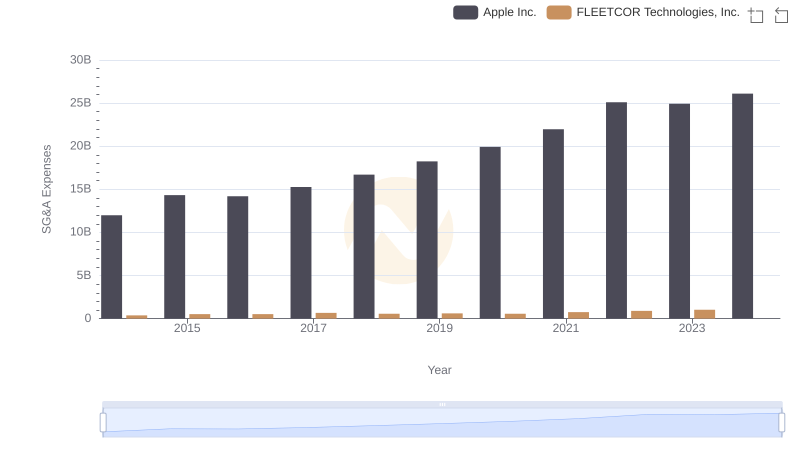
Who Optimizes SG&A Costs Better? Apple Inc. or FLEETCOR Technologies, Inc.
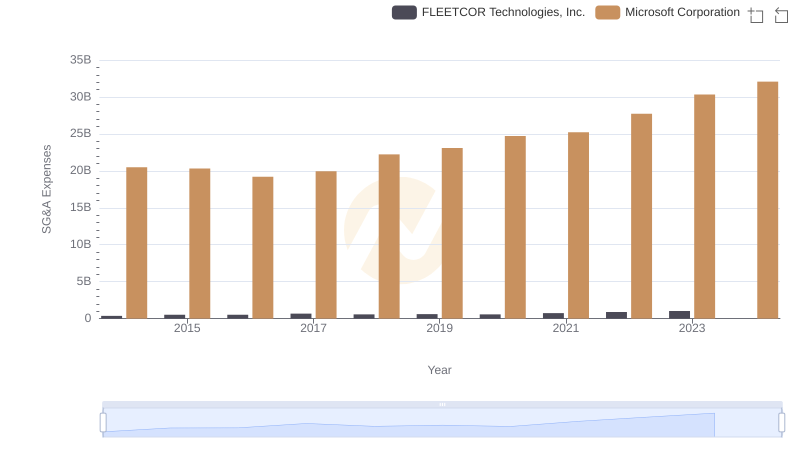
Microsoft Corporation vs FLEETCOR Technologies, Inc.: SG&A Expense Trends
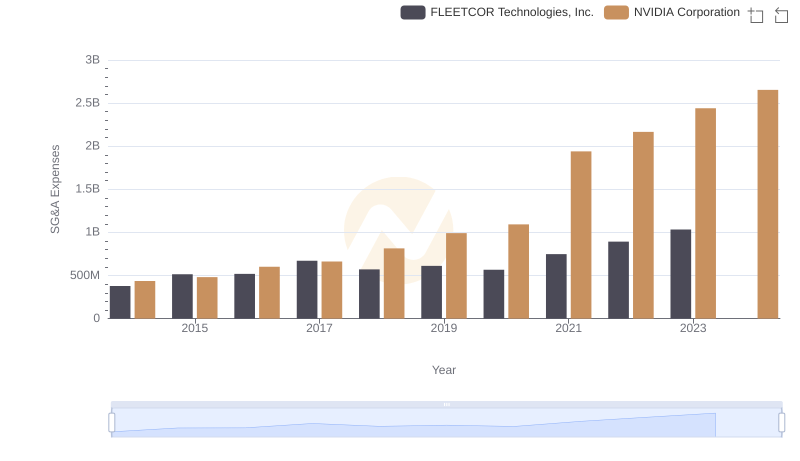
NVIDIA Corporation and FLEETCOR Technologies, Inc.: SG&A Spending Patterns Compared
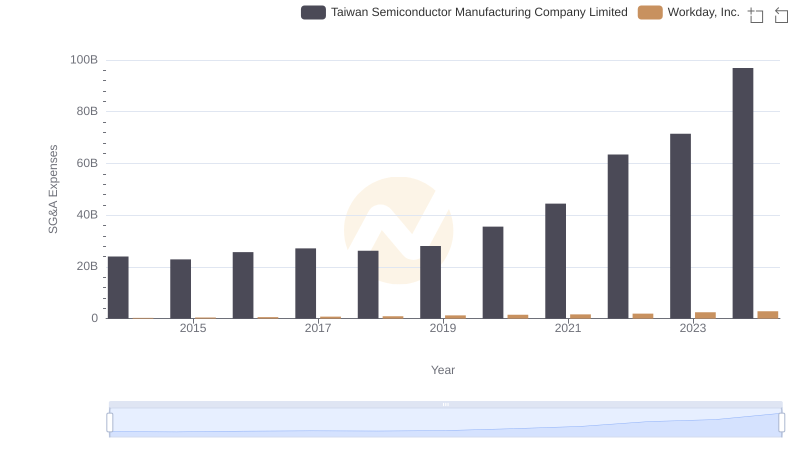
Taiwan Semiconductor Manufacturing Company Limited or Workday, Inc.: Who Manages SG&A Costs Better?
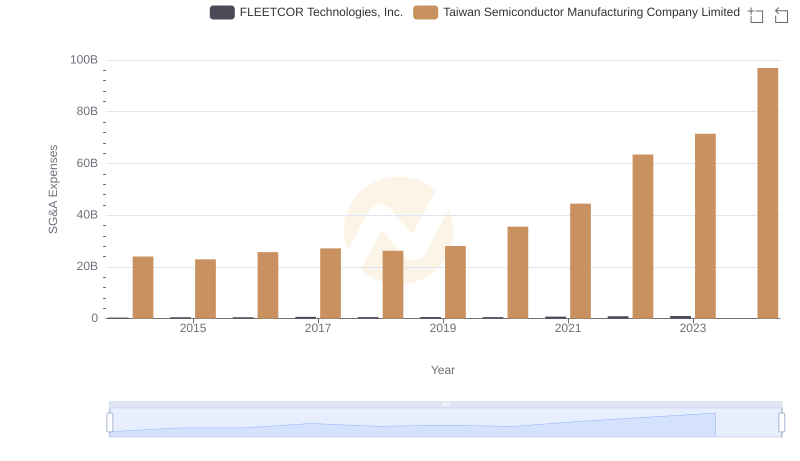
Taiwan Semiconductor Manufacturing Company Limited vs FLEETCOR Technologies, Inc.: SG&A Expense Trends
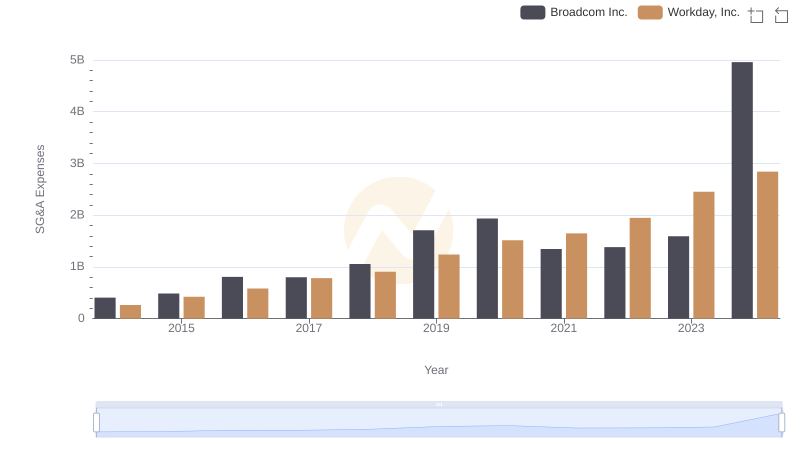
Cost Management Insights: SG&A Expenses for Broadcom Inc. and Workday, Inc.
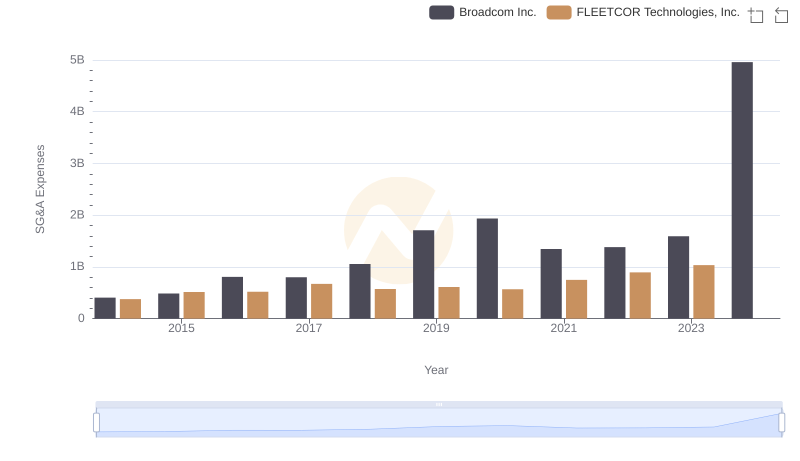
SG&A Efficiency Analysis: Comparing Broadcom Inc. and FLEETCOR Technologies, Inc.
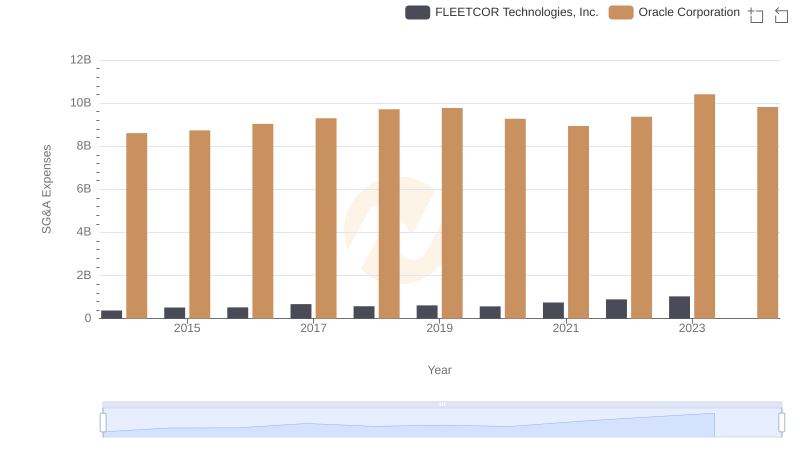
SG&A Efficiency Analysis: Comparing Oracle Corporation and FLEETCOR Technologies, Inc.
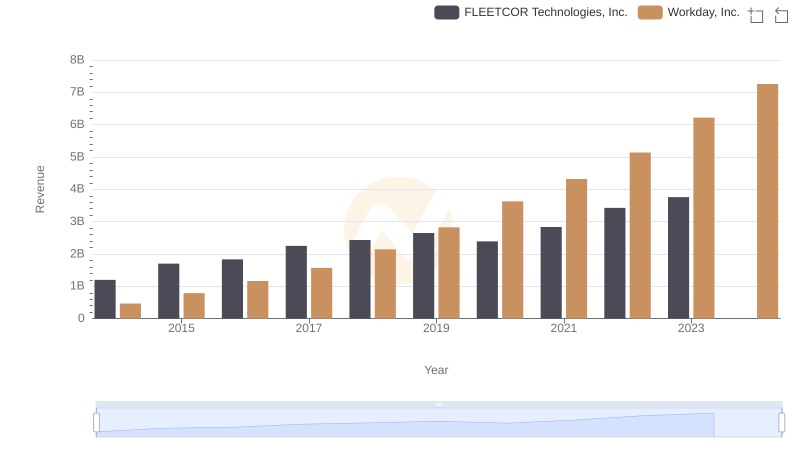
Comparing Revenue Performance: Workday, Inc. or FLEETCOR Technologies, Inc.?
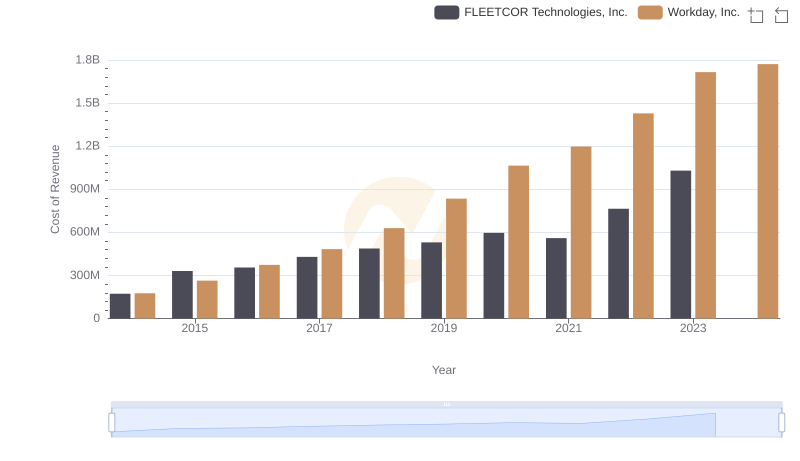
Cost of Revenue Comparison: Workday, Inc. vs FLEETCOR Technologies, Inc.
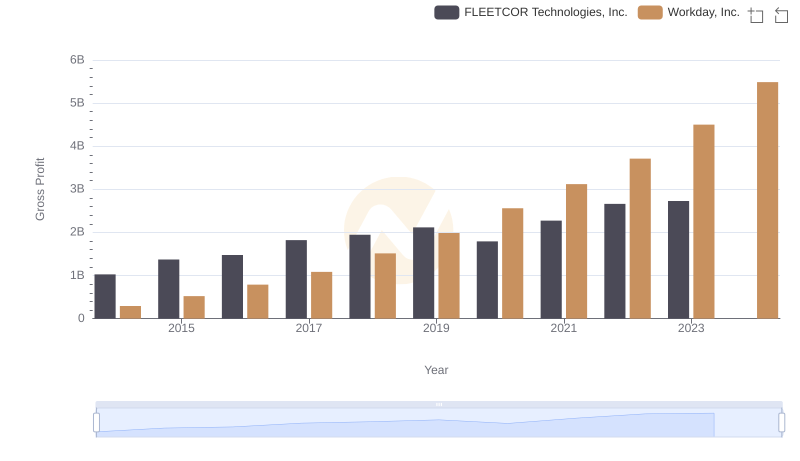
Gross Profit Trends Compared: Workday, Inc. vs FLEETCOR Technologies, Inc.