| __timestamp | Tyler Technologies, Inc. | Wipro Limited |
|---|---|---|
| Wednesday, January 1, 2014 | 233371000 | 148261000000 |
| Thursday, January 1, 2015 | 277187000 | 155716000000 |
| Friday, January 1, 2016 | 355351000 | 158858000000 |
| Sunday, January 1, 2017 | 399140000 | 159296000000 |
| Monday, January 1, 2018 | 439578000 | 172812000000 |
| Tuesday, January 1, 2019 | 516900000 | 174147000000 |
| Wednesday, January 1, 2020 | 542512000 | 196225000000 |
| Friday, January 1, 2021 | 709644000 | 235062000000 |
| Saturday, January 1, 2022 | 783863000 | 259430000000 |
| Sunday, January 1, 2023 | 861099000 | 266106000000 |
| Monday, January 1, 2024 | 935761000 | 266106000000 |
Igniting the spark of knowledge
In the ever-evolving landscape of global technology, Wipro Limited and Tyler Technologies, Inc. stand as intriguing case studies of growth and resilience. Over the past decade, Wipro Limited has consistently demonstrated robust financial health, with its gross profit soaring by approximately 80% from 2014 to 2023. This Indian tech giant's strategic focus on digital transformation and innovation has paid off, as evidenced by its impressive financial trajectory.
Meanwhile, Tyler Technologies, Inc., a leader in public sector software solutions, has experienced a remarkable 270% increase in gross profit over the same period. This growth underscores Tyler's successful expansion and adaptation to the increasing demand for digital solutions in government sectors.
While Wipro's gross profit figures are significantly higher, Tyler's growth rate is a testament to its dynamic market strategy. The data for 2024 is incomplete, leaving room for speculation on future trends.
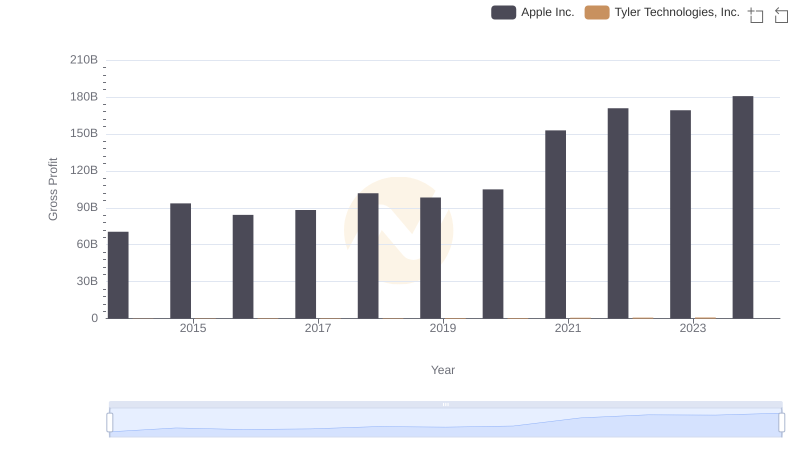
Gross Profit Analysis: Comparing Apple Inc. and Tyler Technologies, Inc.
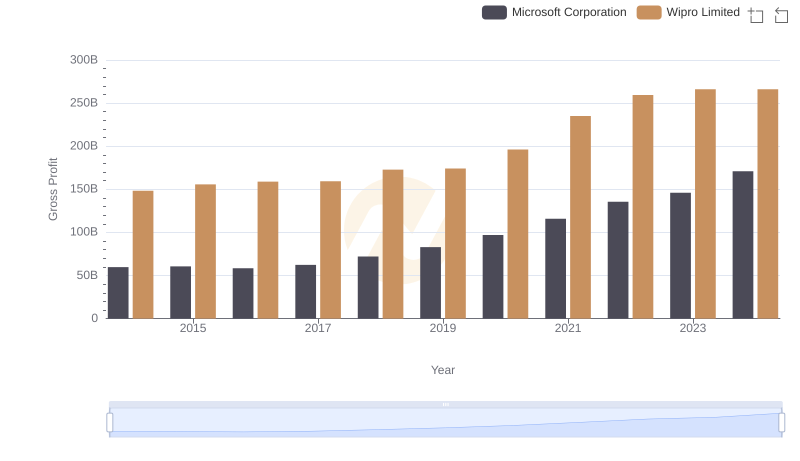
Gross Profit Analysis: Comparing Microsoft Corporation and Wipro Limited
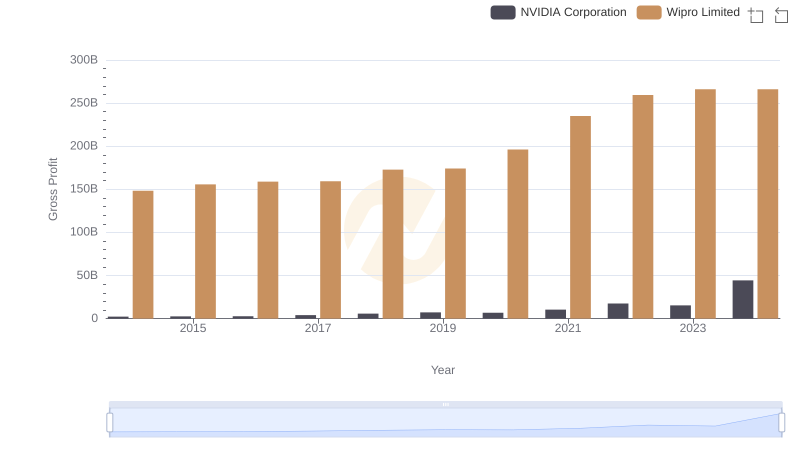
NVIDIA Corporation vs Wipro Limited: A Gross Profit Performance Breakdown
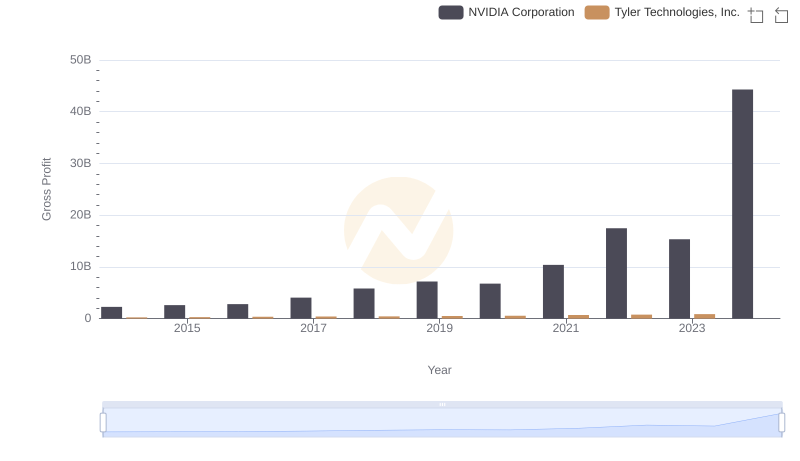
Gross Profit Comparison: NVIDIA Corporation and Tyler Technologies, Inc. Trends
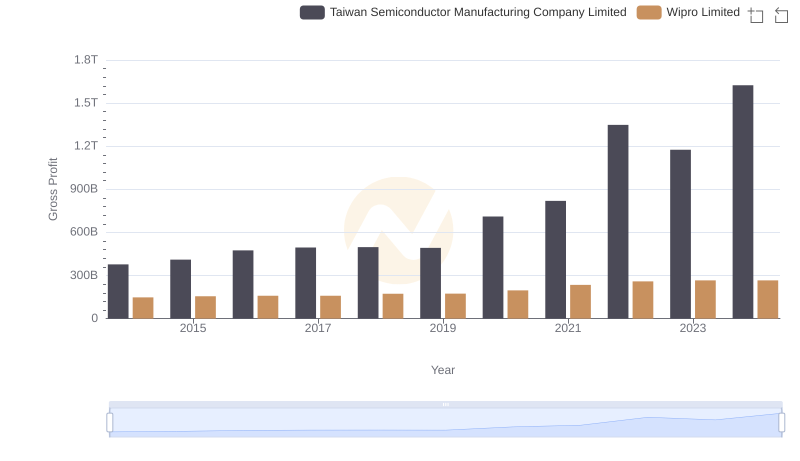
Gross Profit Comparison: Taiwan Semiconductor Manufacturing Company Limited and Wipro Limited Trends
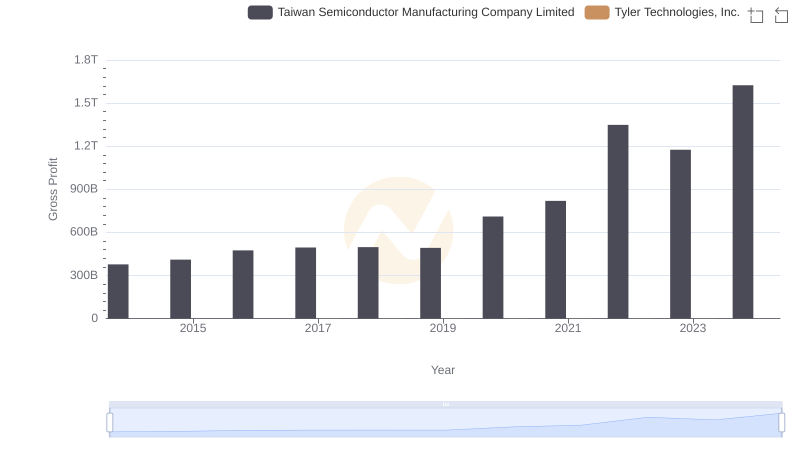
Key Insights on Gross Profit: Taiwan Semiconductor Manufacturing Company Limited vs Tyler Technologies, Inc.
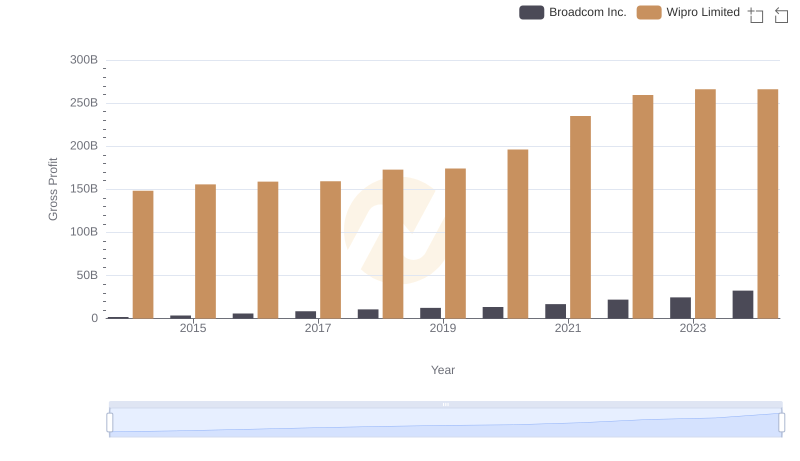
Gross Profit Trends Compared: Broadcom Inc. vs Wipro Limited
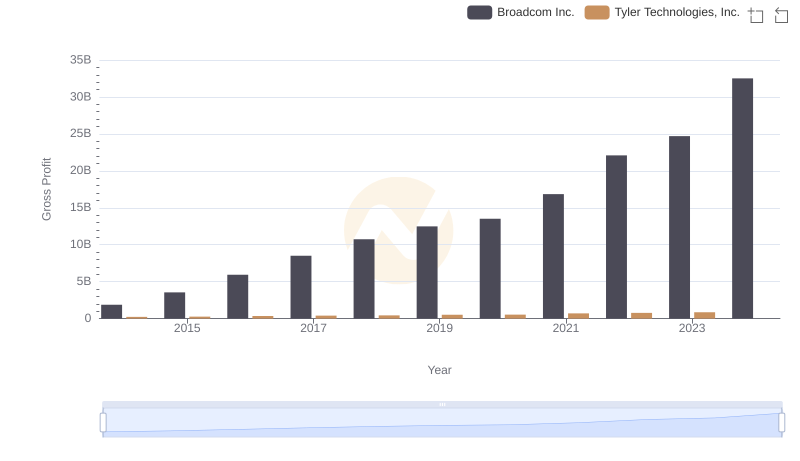
Gross Profit Trends Compared: Broadcom Inc. vs Tyler Technologies, Inc.
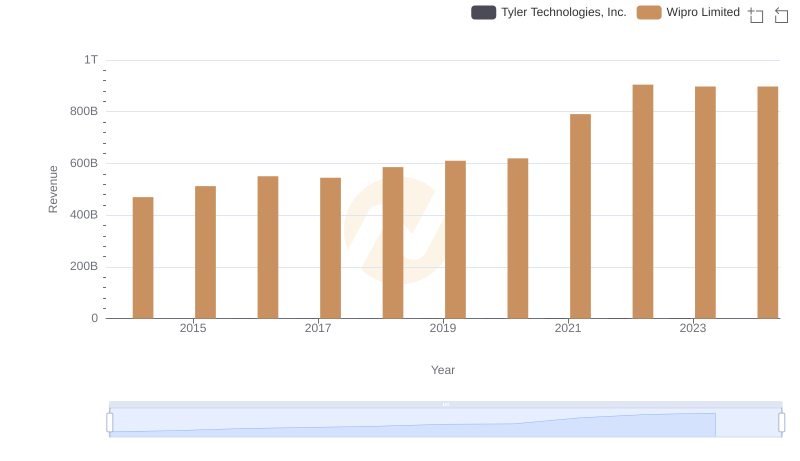
Annual Revenue Comparison: Wipro Limited vs Tyler Technologies, Inc.
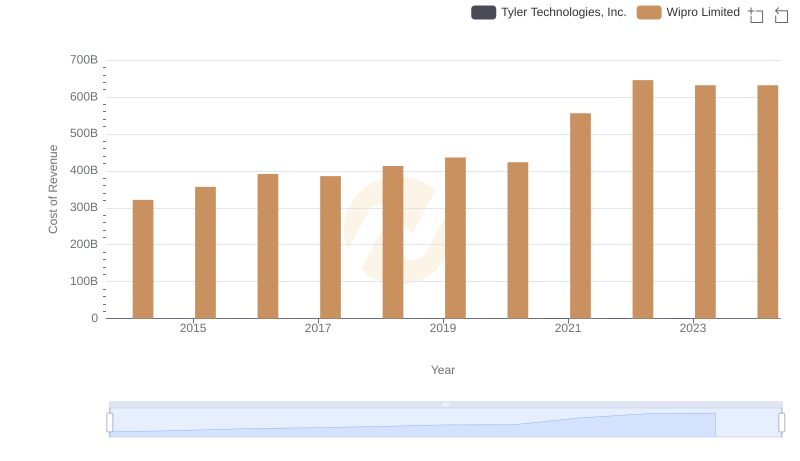
Cost of Revenue Comparison: Wipro Limited vs Tyler Technologies, Inc.
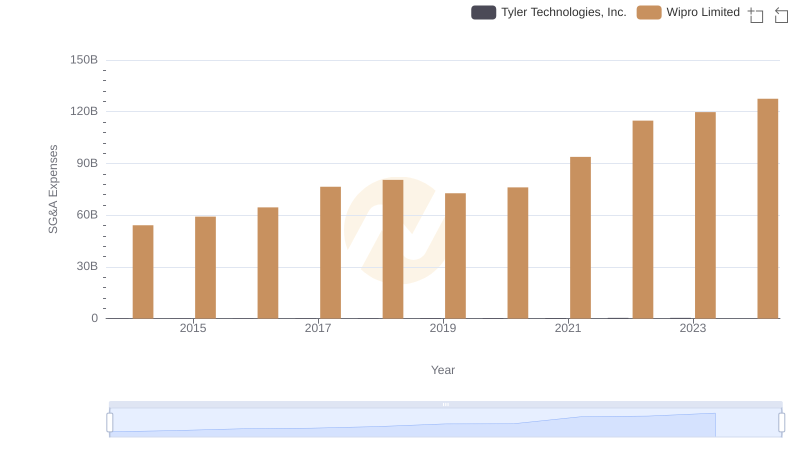
Comparing SG&A Expenses: Wipro Limited vs Tyler Technologies, Inc. Trends and Insights
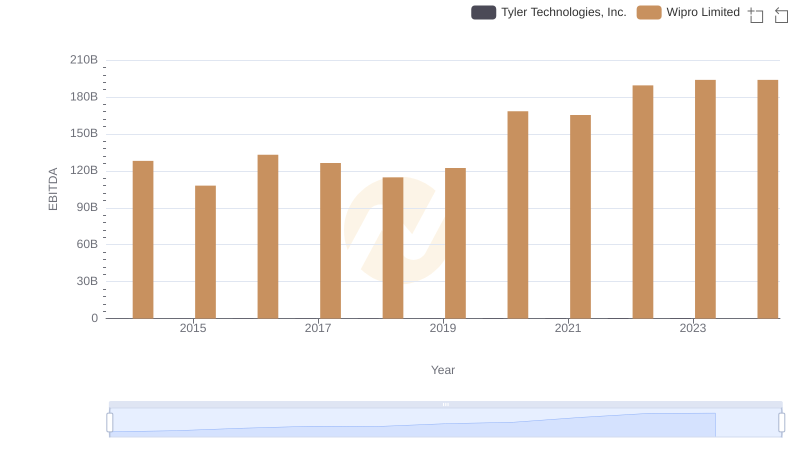
EBITDA Performance Review: Wipro Limited vs Tyler Technologies, Inc.