| __timestamp | Tyler Technologies, Inc. | Wipro Limited |
|---|---|---|
| Wednesday, January 1, 2014 | 109427000 | 128105000000 |
| Thursday, January 1, 2015 | 127617000 | 107958000000 |
| Friday, January 1, 2016 | 165194000 | 133082000000 |
| Sunday, January 1, 2017 | 194467000 | 126406000000 |
| Monday, January 1, 2018 | 191279000 | 114648000000 |
| Tuesday, January 1, 2019 | 233039000 | 122279000000 |
| Wednesday, January 1, 2020 | 254583000 | 168413000000 |
| Friday, January 1, 2021 | 328119000 | 165303000000 |
| Saturday, January 1, 2022 | 388013000 | 189377000000 |
| Sunday, January 1, 2023 | 392632000 | 193833000000 |
| Monday, January 1, 2024 | 299526000 | 193833000000 |
Unveiling the hidden dimensions of data
In the ever-evolving landscape of global technology, understanding the financial health of industry leaders is crucial. This analysis delves into the EBITDA performance of Wipro Limited and Tyler Technologies, Inc. from 2014 to 2023. Over this decade, Wipro Limited consistently outperformed Tyler Technologies, Inc., with an average EBITDA approximately 625% higher. Notably, Wipro's EBITDA peaked in 2023, reaching nearly 194 billion, marking a 51% increase from its 2014 figures. In contrast, Tyler Technologies, Inc. demonstrated a steady growth trajectory, with its EBITDA rising by 259% over the same period, peaking at nearly 393 million in 2023. However, data for 2024 is incomplete, highlighting the need for continuous monitoring. This comparison underscores the diverse growth strategies and market positions of these two tech giants, offering valuable insights for investors and industry analysts alike.
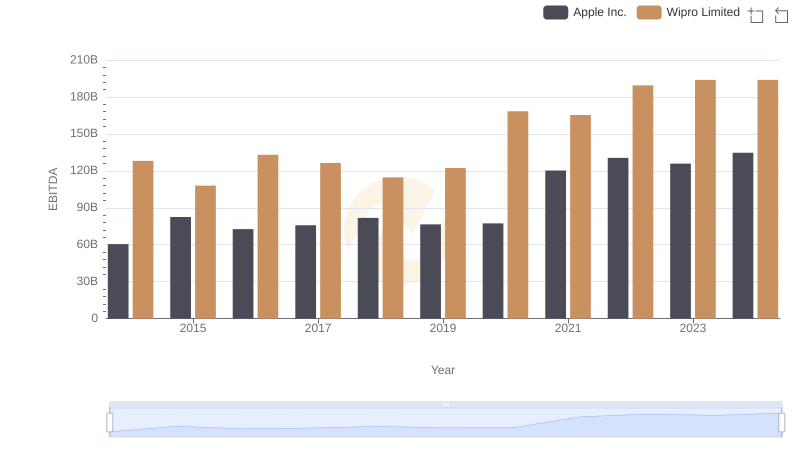
EBITDA Analysis: Evaluating Apple Inc. Against Wipro Limited
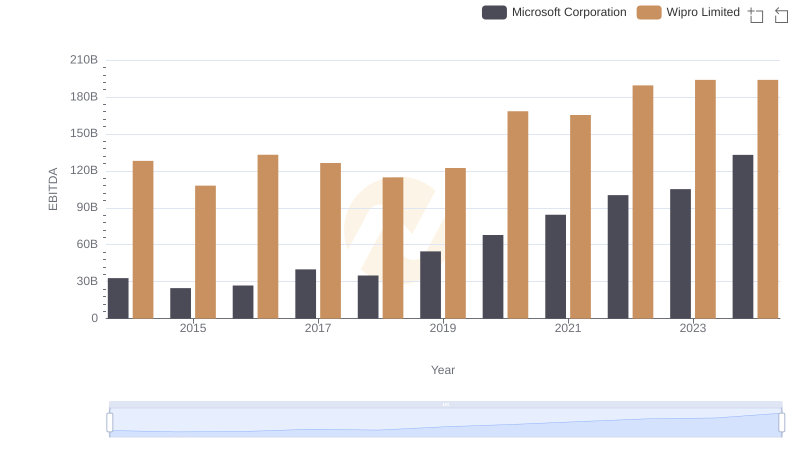
Professional EBITDA Benchmarking: Microsoft Corporation vs Wipro Limited
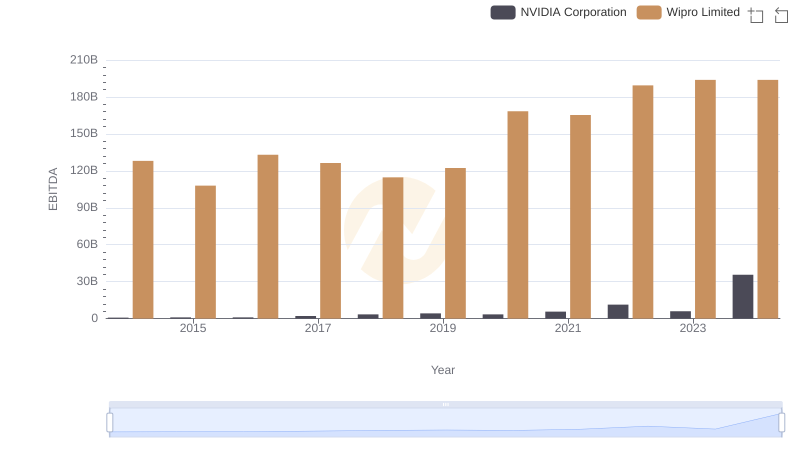
NVIDIA Corporation and Wipro Limited: A Detailed Examination of EBITDA Performance
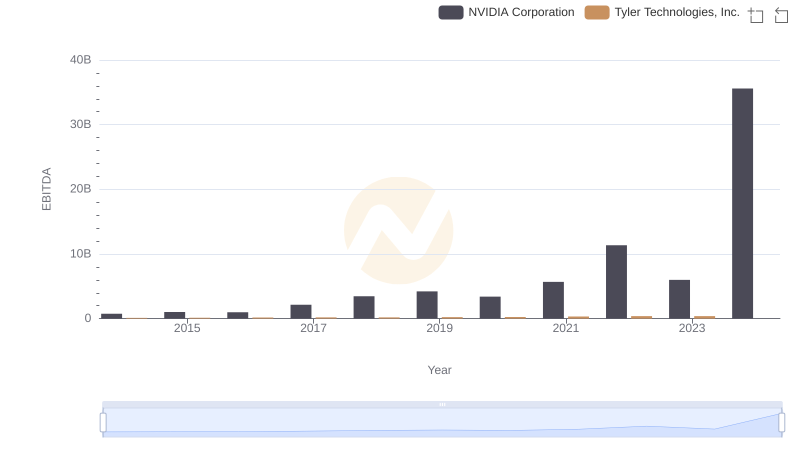
Comparative EBITDA Analysis: NVIDIA Corporation vs Tyler Technologies, Inc.
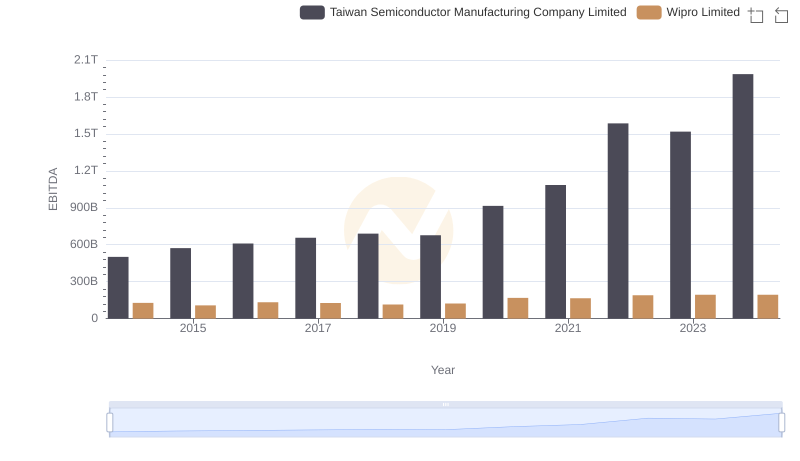
EBITDA Metrics Evaluated: Taiwan Semiconductor Manufacturing Company Limited vs Wipro Limited
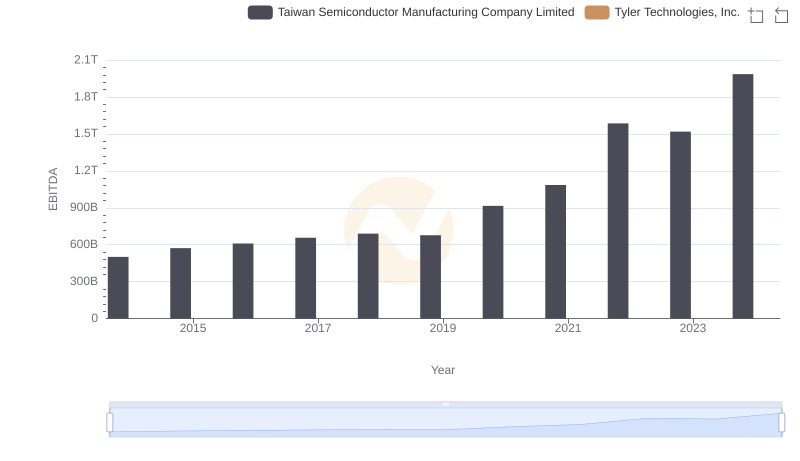
EBITDA Performance Review: Taiwan Semiconductor Manufacturing Company Limited vs Tyler Technologies, Inc.
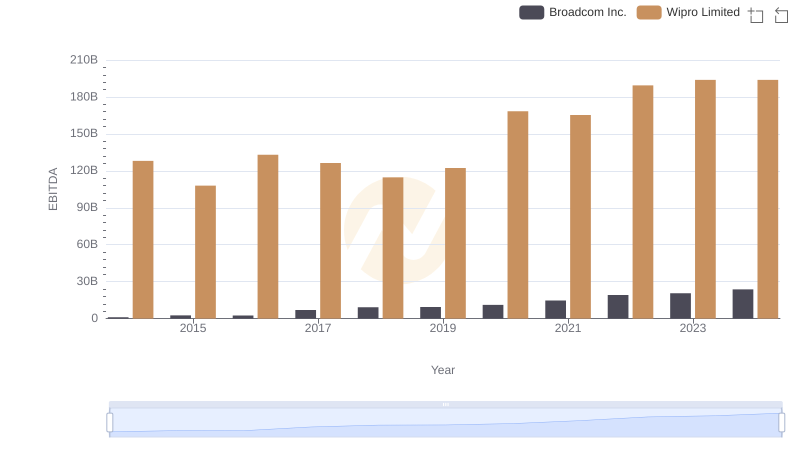
Broadcom Inc. and Wipro Limited: A Detailed Examination of EBITDA Performance
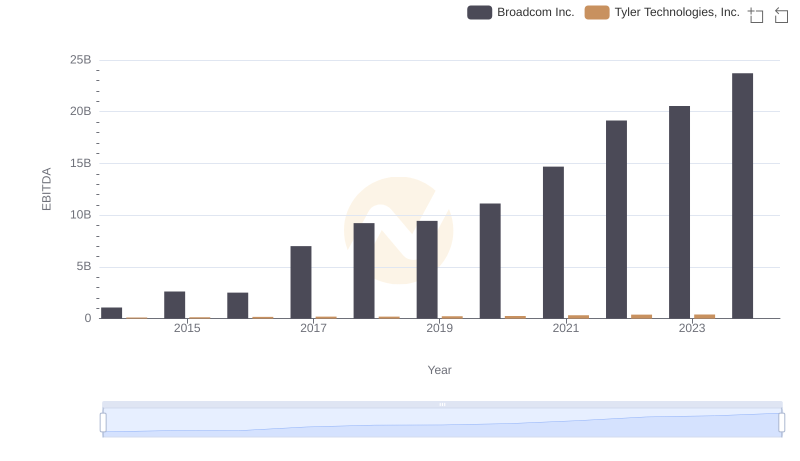
EBITDA Performance Review: Broadcom Inc. vs Tyler Technologies, Inc.
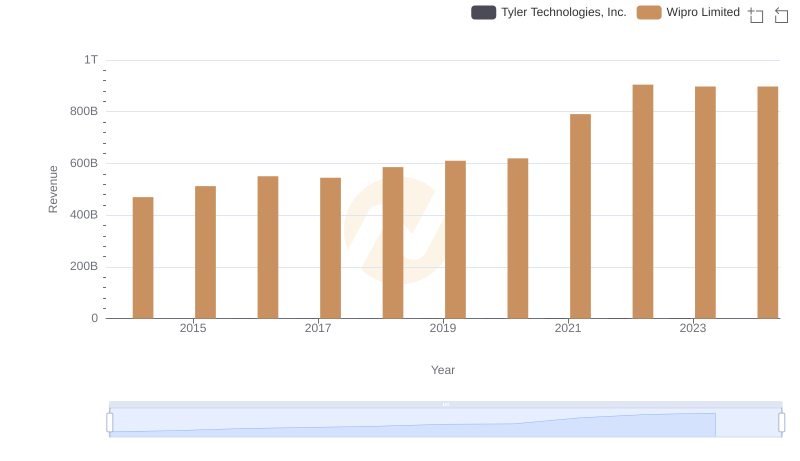
Annual Revenue Comparison: Wipro Limited vs Tyler Technologies, Inc.
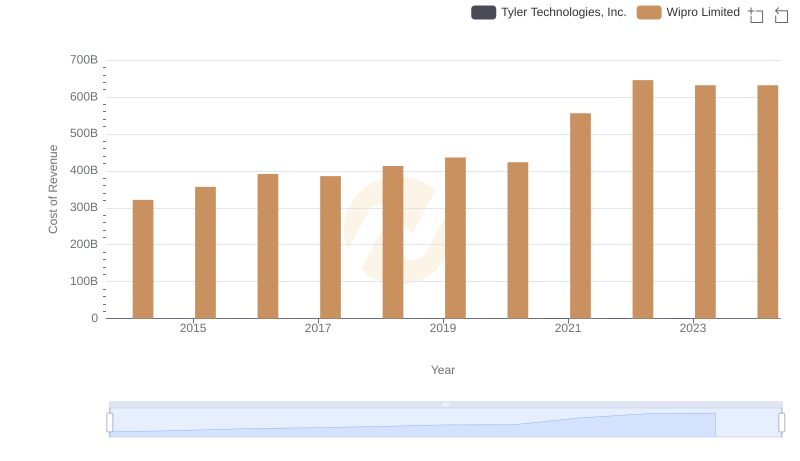
Cost of Revenue Comparison: Wipro Limited vs Tyler Technologies, Inc.

Gross Profit Trends Compared: Wipro Limited vs Tyler Technologies, Inc.
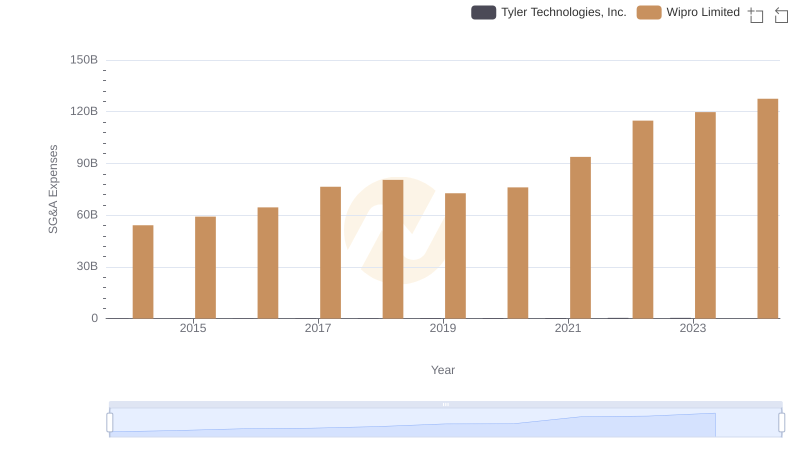
Comparing SG&A Expenses: Wipro Limited vs Tyler Technologies, Inc. Trends and Insights