| __timestamp | Tyler Technologies, Inc. | Wipro Limited |
|---|---|---|
| Wednesday, January 1, 2014 | 259730000 | 321284000000 |
| Thursday, January 1, 2015 | 313835000 | 356724000000 |
| Friday, January 1, 2016 | 400692000 | 391544000000 |
| Sunday, January 1, 2017 | 441522000 | 385575000000 |
| Monday, January 1, 2018 | 495704000 | 413033000000 |
| Tuesday, January 1, 2019 | 569527000 | 436085000000 |
| Wednesday, January 1, 2020 | 574151000 | 423205000000 |
| Friday, January 1, 2021 | 882643000 | 555872000000 |
| Saturday, January 1, 2022 | 1066341000 | 645446000000 |
| Sunday, January 1, 2023 | 1090652000 | 631497000000 |
| Monday, January 1, 2024 | 1202042000 | 631497000000 |
Igniting the spark of knowledge
In the ever-evolving landscape of technology, understanding the cost of revenue is crucial for assessing a company's financial health. This chart offers a fascinating comparison between Wipro Limited and Tyler Technologies, Inc., two giants in their respective fields.
From 2014 to 2023, Wipro Limited consistently reported a cost of revenue that dwarfed Tyler Technologies, Inc. by over 99%. In 2022, Wipro's cost of revenue peaked at approximately 645 billion, while Tyler Technologies reached its highest at around 1.1 billion. This stark contrast highlights the scale at which Wipro operates compared to Tyler Technologies.
While the data for 2024 is incomplete, the trend suggests Wipro's cost of revenue remains stable, whereas Tyler Technologies shows a steady upward trajectory. This analysis provides a window into the financial strategies and market positions of these two companies.
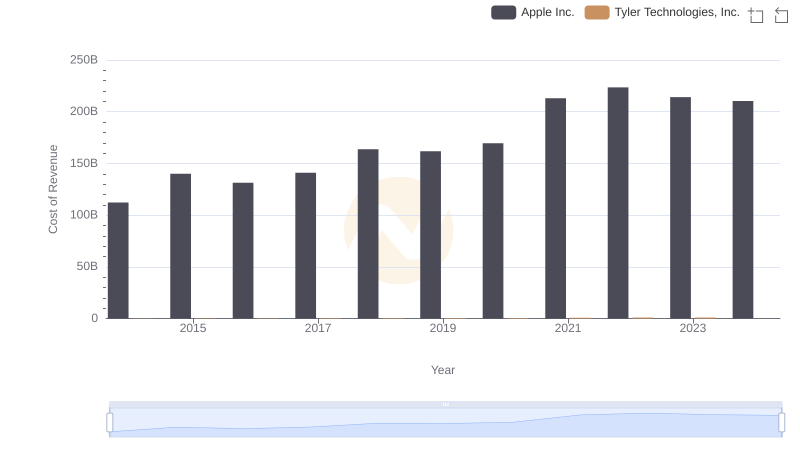
Apple Inc. vs Tyler Technologies, Inc.: Efficiency in Cost of Revenue Explored
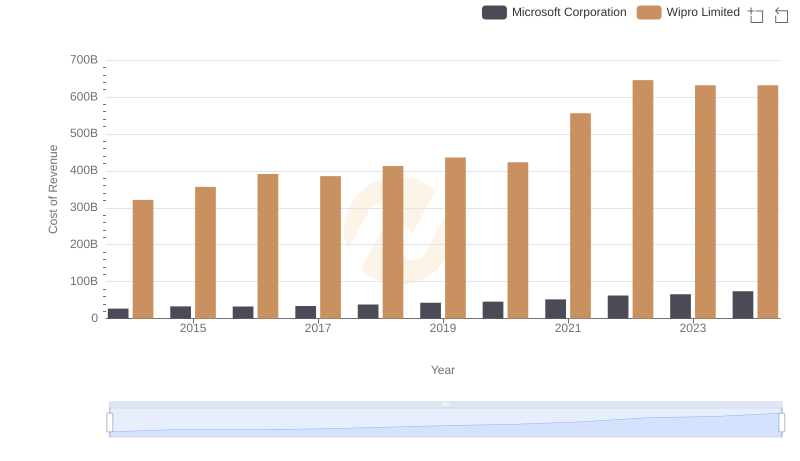
Cost of Revenue: Key Insights for Microsoft Corporation and Wipro Limited
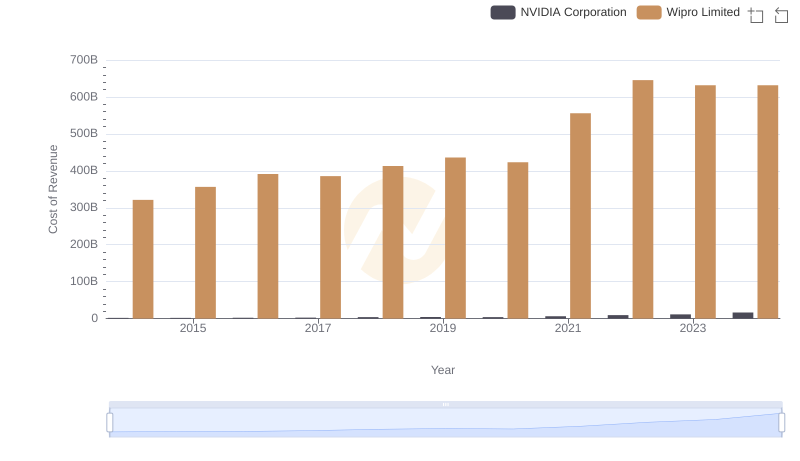
Cost of Revenue Comparison: NVIDIA Corporation vs Wipro Limited
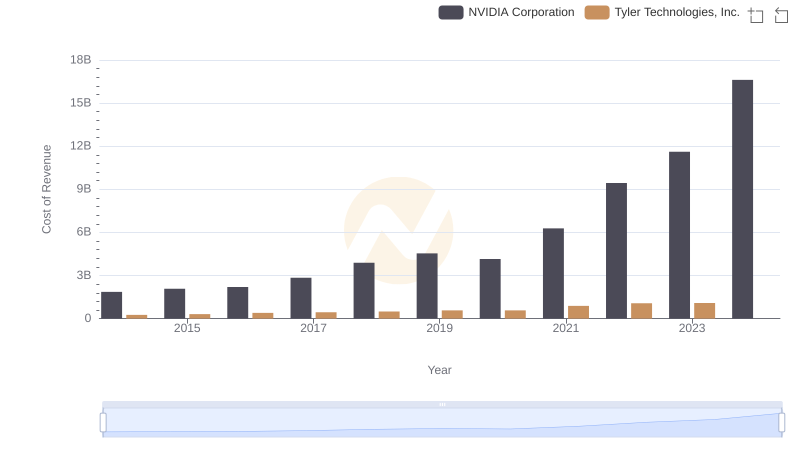
Analyzing Cost of Revenue: NVIDIA Corporation and Tyler Technologies, Inc.
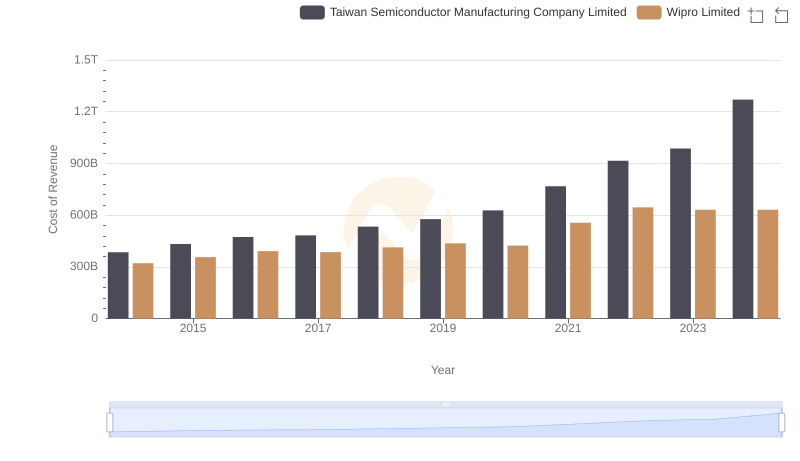
Cost of Revenue Comparison: Taiwan Semiconductor Manufacturing Company Limited vs Wipro Limited
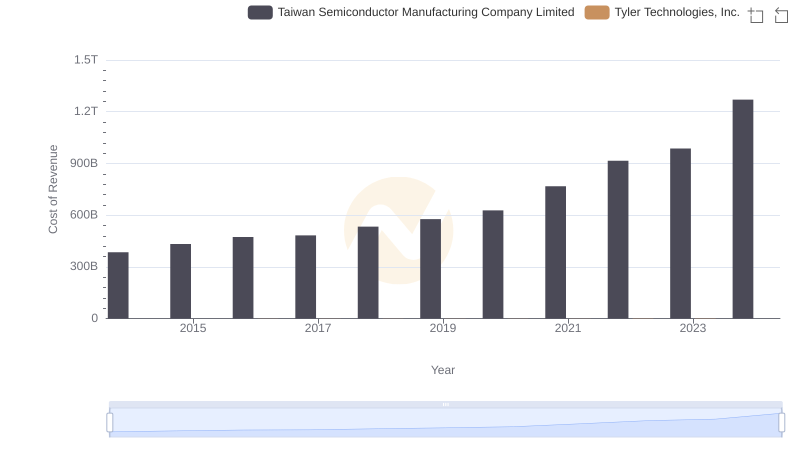
Cost of Revenue Comparison: Taiwan Semiconductor Manufacturing Company Limited vs Tyler Technologies, Inc.
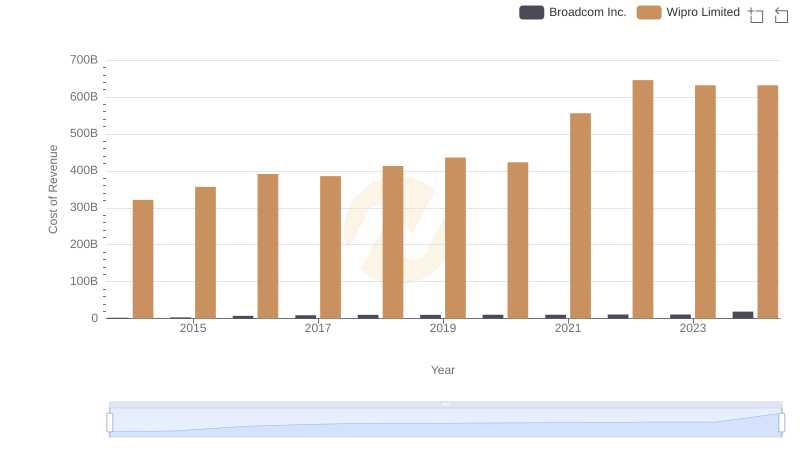
Comparing Cost of Revenue Efficiency: Broadcom Inc. vs Wipro Limited
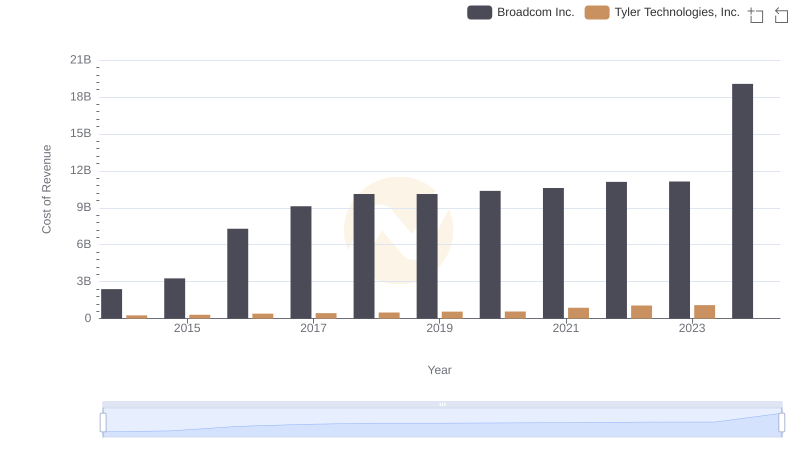
Cost of Revenue: Key Insights for Broadcom Inc. and Tyler Technologies, Inc.
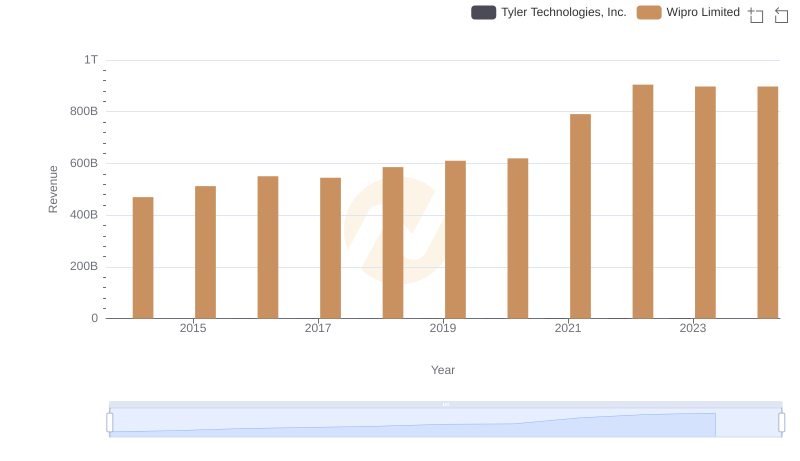
Annual Revenue Comparison: Wipro Limited vs Tyler Technologies, Inc.

Gross Profit Trends Compared: Wipro Limited vs Tyler Technologies, Inc.
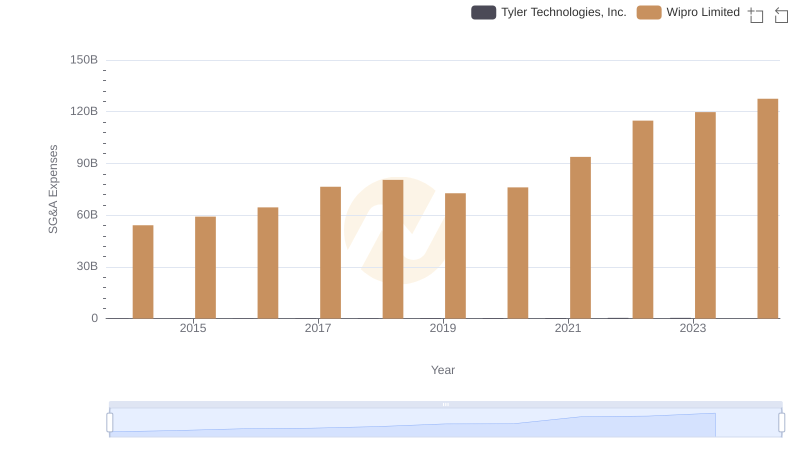
Comparing SG&A Expenses: Wipro Limited vs Tyler Technologies, Inc. Trends and Insights
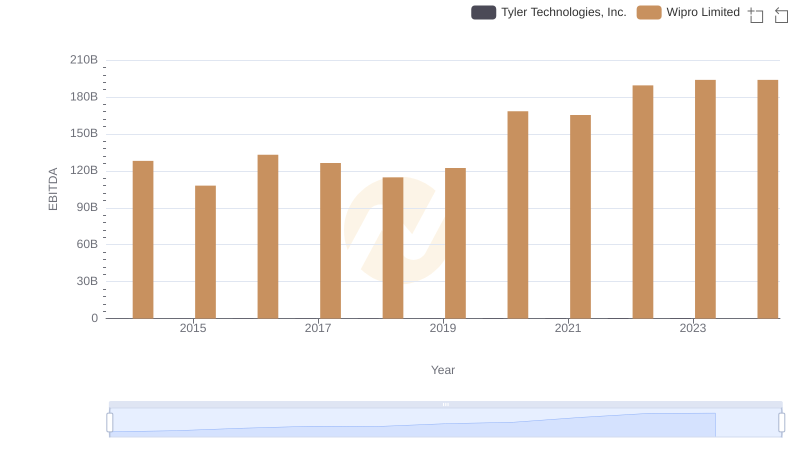
EBITDA Performance Review: Wipro Limited vs Tyler Technologies, Inc.