| __timestamp | FLEETCOR Technologies, Inc. | Western Digital Corporation |
|---|---|---|
| Wednesday, January 1, 2014 | 1026053000 | 4360000000 |
| Thursday, January 1, 2015 | 1371792000 | 4221000000 |
| Friday, January 1, 2016 | 1476132000 | 3435000000 |
| Sunday, January 1, 2017 | 1819925000 | 6072000000 |
| Monday, January 1, 2018 | 1945797000 | 7705000000 |
| Tuesday, January 1, 2019 | 2118179000 | 3752000000 |
| Wednesday, January 1, 2020 | 1792492000 | 3781000000 |
| Friday, January 1, 2021 | 2273917000 | 4521000000 |
| Saturday, January 1, 2022 | 2662422000 | 5874000000 |
| Sunday, January 1, 2023 | 2727580001 | 1887000000 |
| Monday, January 1, 2024 | 3974589000 | 2945000000 |
Igniting the spark of knowledge
In the ever-evolving landscape of technology and financial services, Western Digital Corporation and FLEETCOR Technologies, Inc. have showcased intriguing gross profit trends over the past decade. From 2014 to 2023, Western Digital's gross profit peaked in 2018, reaching nearly double its 2014 value, before experiencing a significant dip in 2023. Meanwhile, FLEETCOR Technologies demonstrated a steady upward trajectory, with its gross profit increasing by approximately 166% from 2014 to 2023.
Western Digital's volatile journey reflects the challenges and opportunities in the tech industry, while FLEETCOR's consistent growth underscores its robust position in financial services. The data for 2024 is incomplete, leaving room for speculation on future trends. As these companies navigate the complexities of their respective sectors, their financial performance offers valuable insights into broader market dynamics.
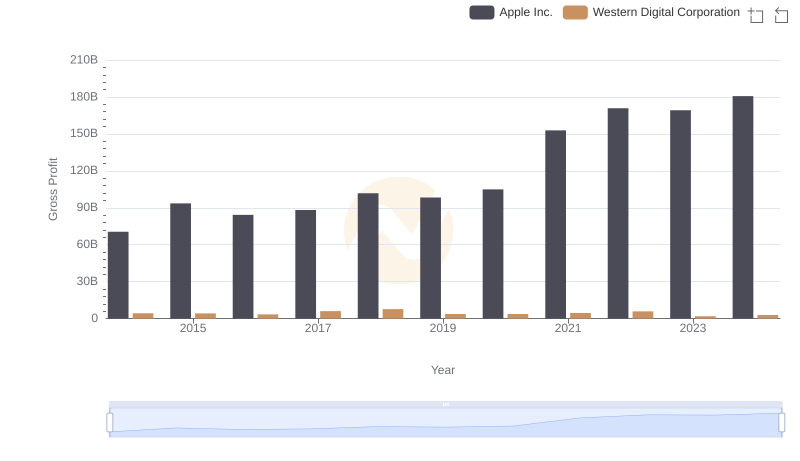
Gross Profit Analysis: Comparing Apple Inc. and Western Digital Corporation
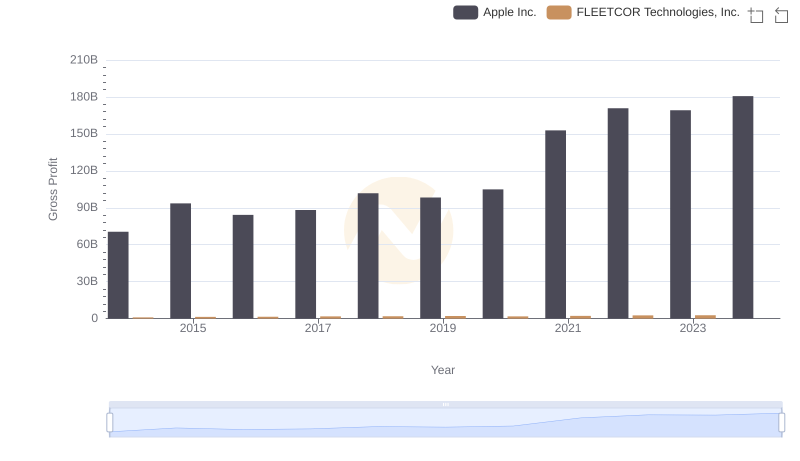
Apple Inc. and FLEETCOR Technologies, Inc.: A Detailed Gross Profit Analysis
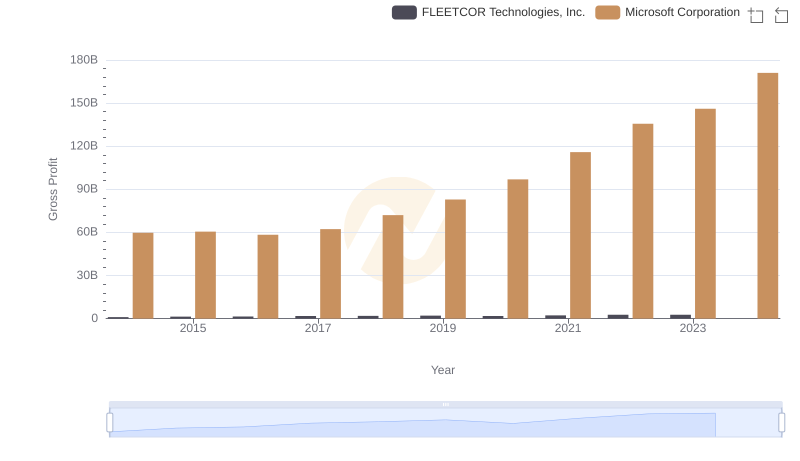
Gross Profit Trends Compared: Microsoft Corporation vs FLEETCOR Technologies, Inc.
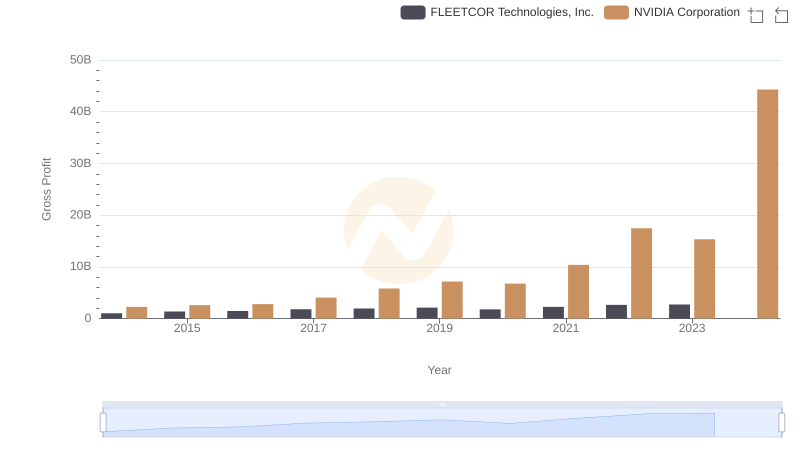
Key Insights on Gross Profit: NVIDIA Corporation vs FLEETCOR Technologies, Inc.
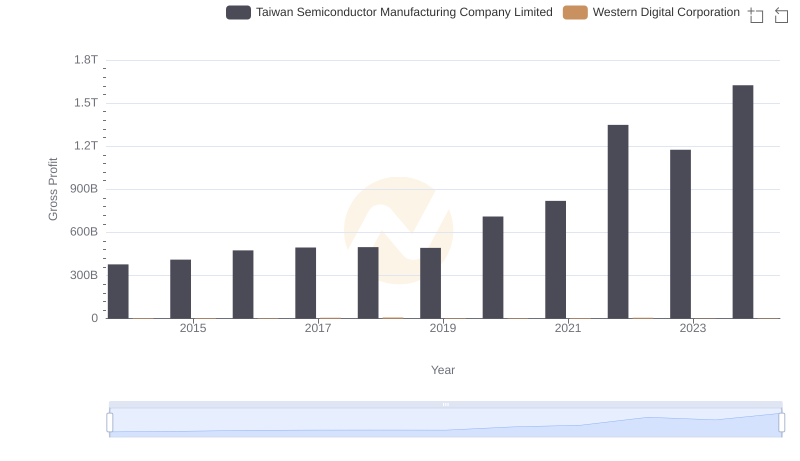
Taiwan Semiconductor Manufacturing Company Limited vs Western Digital Corporation: A Gross Profit Performance Breakdown
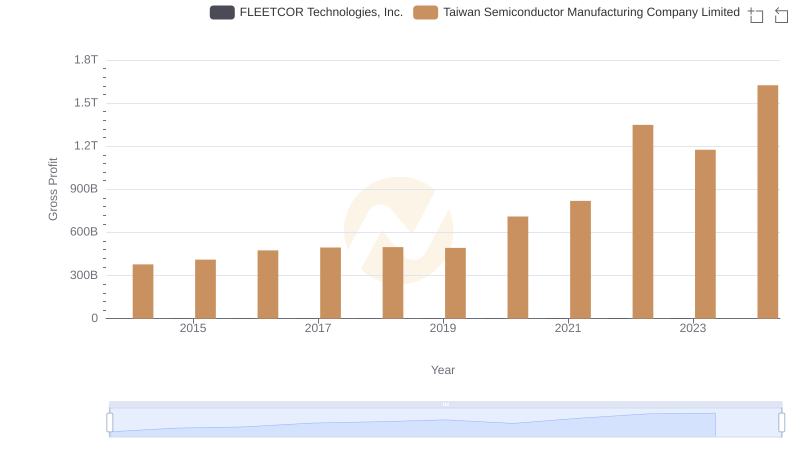
Gross Profit Comparison: Taiwan Semiconductor Manufacturing Company Limited and FLEETCOR Technologies, Inc. Trends
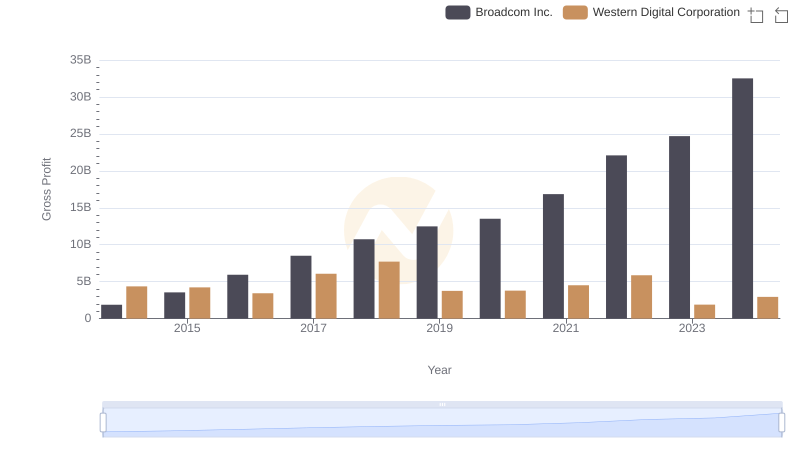
Gross Profit Analysis: Comparing Broadcom Inc. and Western Digital Corporation
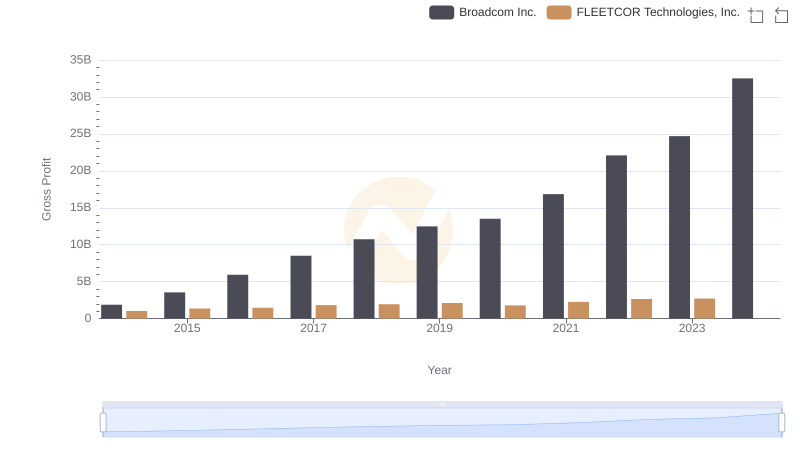
Gross Profit Analysis: Comparing Broadcom Inc. and FLEETCOR Technologies, Inc.
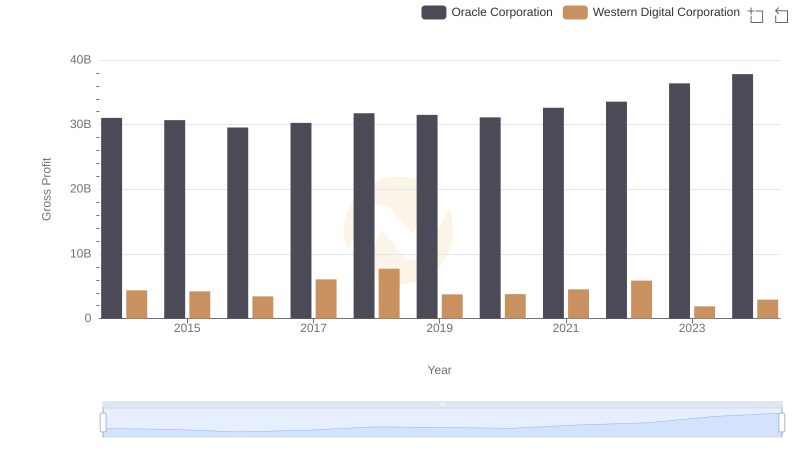
Gross Profit Comparison: Oracle Corporation and Western Digital Corporation Trends
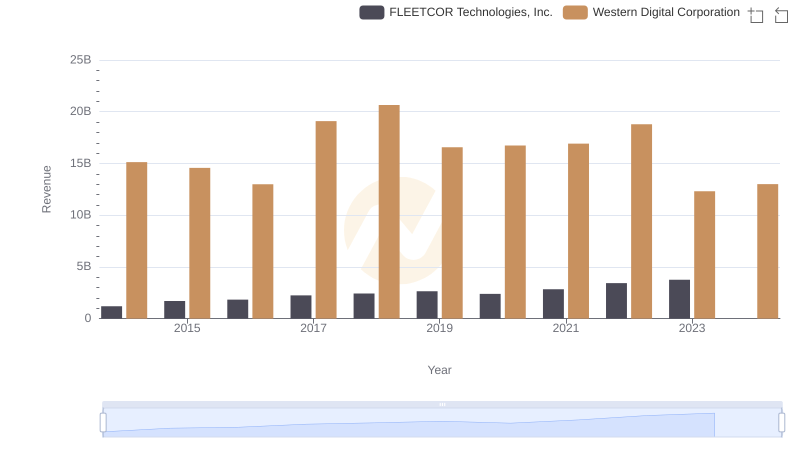
Western Digital Corporation vs FLEETCOR Technologies, Inc.: Examining Key Revenue Metrics
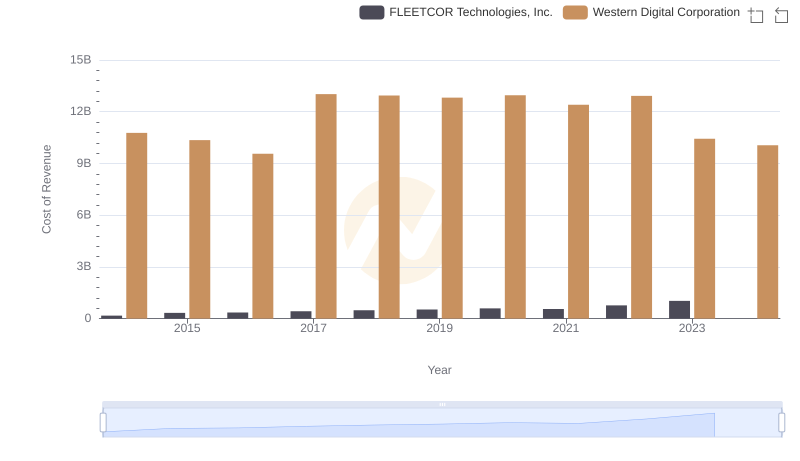
Analyzing Cost of Revenue: Western Digital Corporation and FLEETCOR Technologies, Inc.
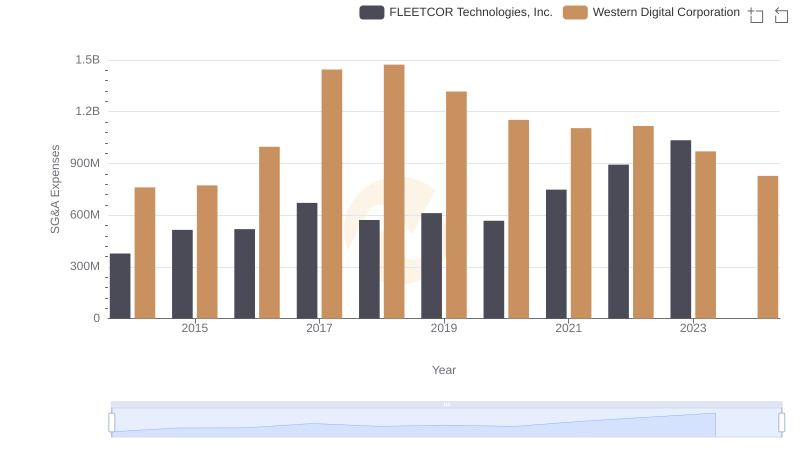
Cost Management Insights: SG&A Expenses for Western Digital Corporation and FLEETCOR Technologies, Inc.