| __timestamp | FLEETCOR Technologies, Inc. | Western Digital Corporation |
|---|---|---|
| Wednesday, January 1, 2014 | 173337000 | 10770000000 |
| Thursday, January 1, 2015 | 331073000 | 10351000000 |
| Friday, January 1, 2016 | 355414000 | 9559000000 |
| Sunday, January 1, 2017 | 429613000 | 13021000000 |
| Monday, January 1, 2018 | 487695000 | 12942000000 |
| Tuesday, January 1, 2019 | 530669000 | 12817000000 |
| Wednesday, January 1, 2020 | 596363000 | 12955000000 |
| Friday, January 1, 2021 | 559819000 | 12401000000 |
| Saturday, January 1, 2022 | 764707000 | 12919000000 |
| Sunday, January 1, 2023 | 1030138999 | 10431000000 |
| Monday, January 1, 2024 | 0 | 10058000000 |
Cracking the code
In the ever-evolving landscape of technology and financial services, understanding cost structures is crucial. Western Digital Corporation, a leader in data storage solutions, and FLEETCOR Technologies, a global business payments company, offer intriguing insights into their cost of revenue over the past decade. From 2014 to 2023, Western Digital's cost of revenue has shown a slight decline, with a notable drop of approximately 7% from its peak in 2017. In contrast, FLEETCOR Technologies has experienced a steady increase, with a remarkable 495% rise from 2014 to 2023. This divergence highlights the distinct operational challenges and strategies of these companies. While Western Digital navigates the complexities of hardware production, FLEETCOR expands its financial services footprint. Missing data for 2024 suggests ongoing developments, inviting further analysis in the coming years.
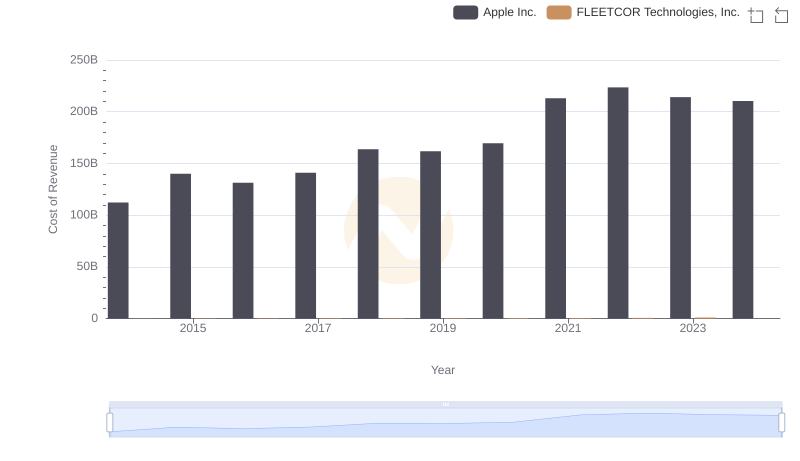
Apple Inc. vs FLEETCOR Technologies, Inc.: Efficiency in Cost of Revenue Explored
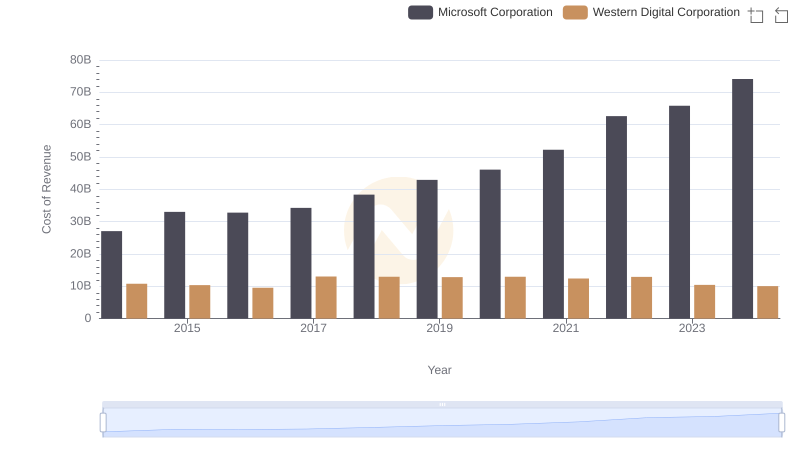
Cost of Revenue: Key Insights for Microsoft Corporation and Western Digital Corporation
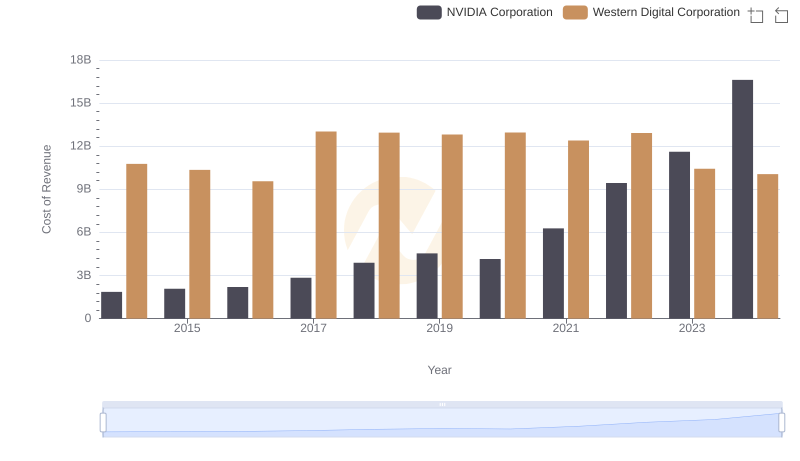
Cost of Revenue: Key Insights for NVIDIA Corporation and Western Digital Corporation
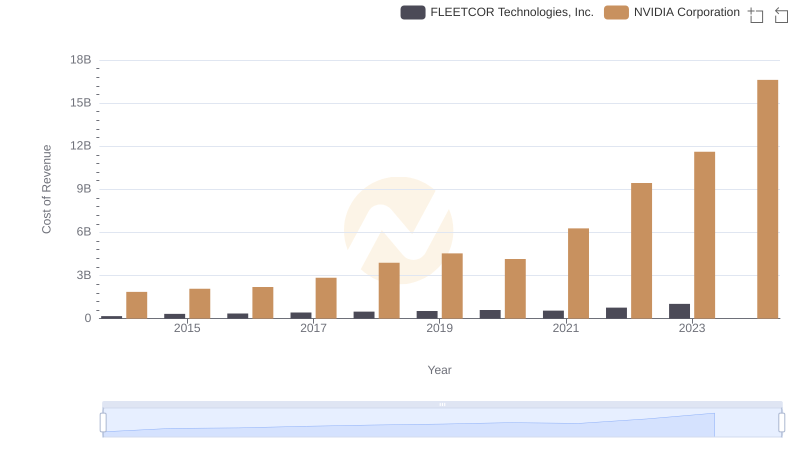
Cost Insights: Breaking Down NVIDIA Corporation and FLEETCOR Technologies, Inc.'s Expenses
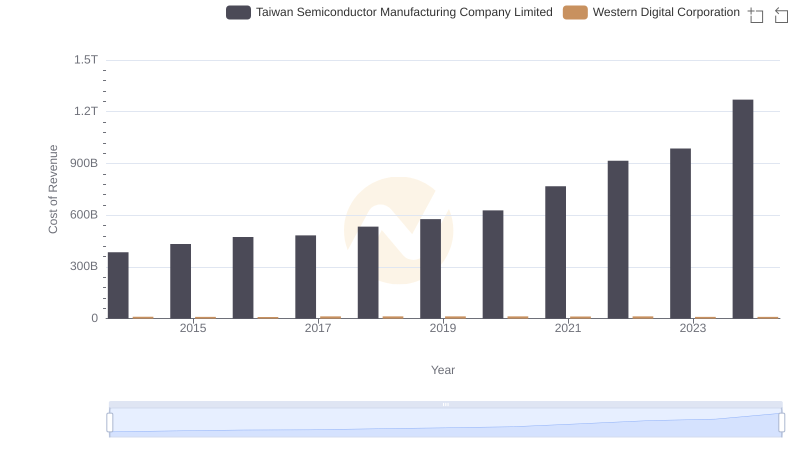
Taiwan Semiconductor Manufacturing Company Limited vs Western Digital Corporation: Efficiency in Cost of Revenue Explored
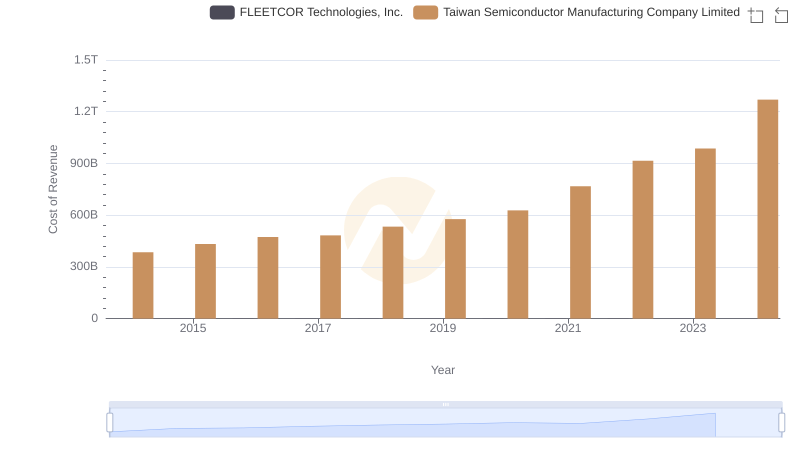
Cost of Revenue Comparison: Taiwan Semiconductor Manufacturing Company Limited vs FLEETCOR Technologies, Inc.
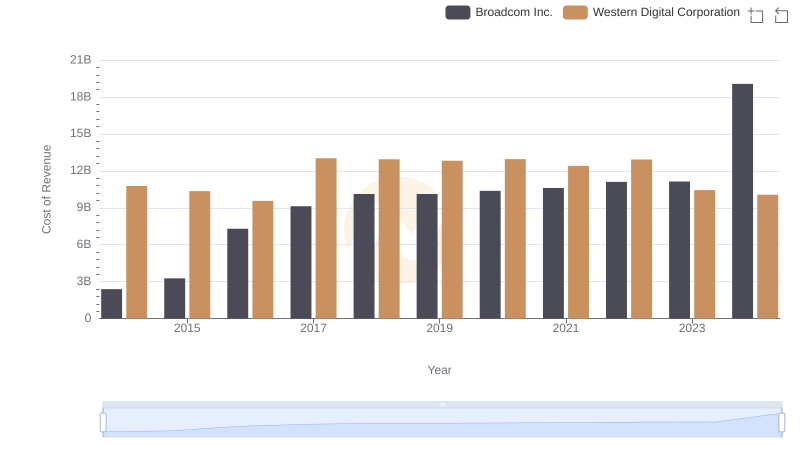
Analyzing Cost of Revenue: Broadcom Inc. and Western Digital Corporation
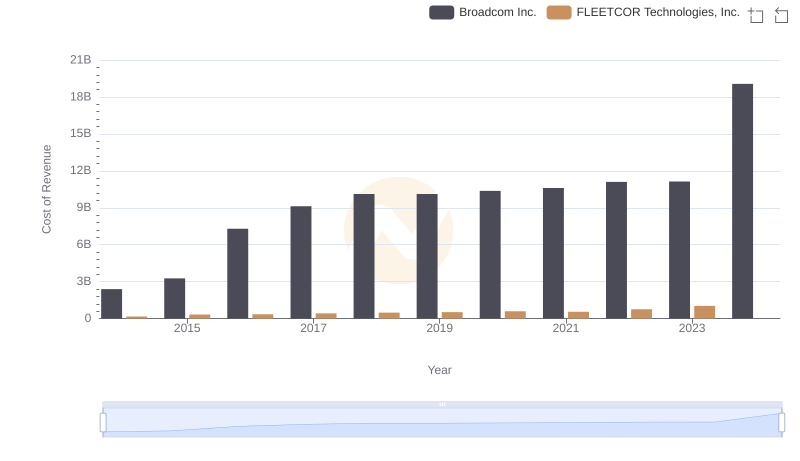
Broadcom Inc. vs FLEETCOR Technologies, Inc.: Efficiency in Cost of Revenue Explored
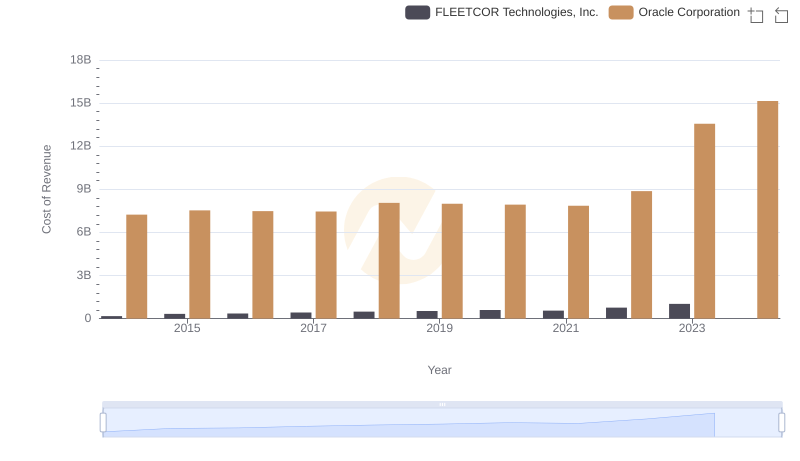
Analyzing Cost of Revenue: Oracle Corporation and FLEETCOR Technologies, Inc.
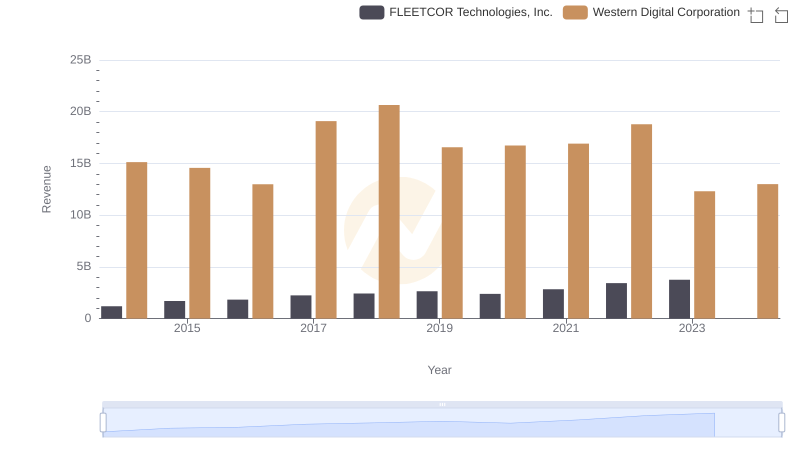
Western Digital Corporation vs FLEETCOR Technologies, Inc.: Examining Key Revenue Metrics
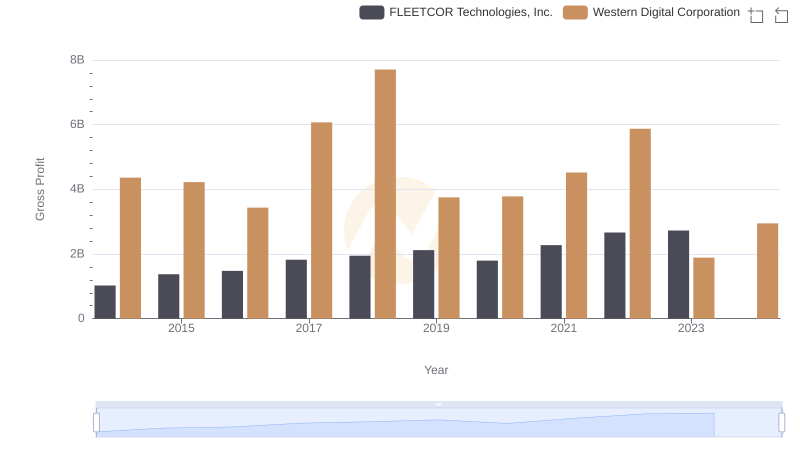
Gross Profit Trends Compared: Western Digital Corporation vs FLEETCOR Technologies, Inc.
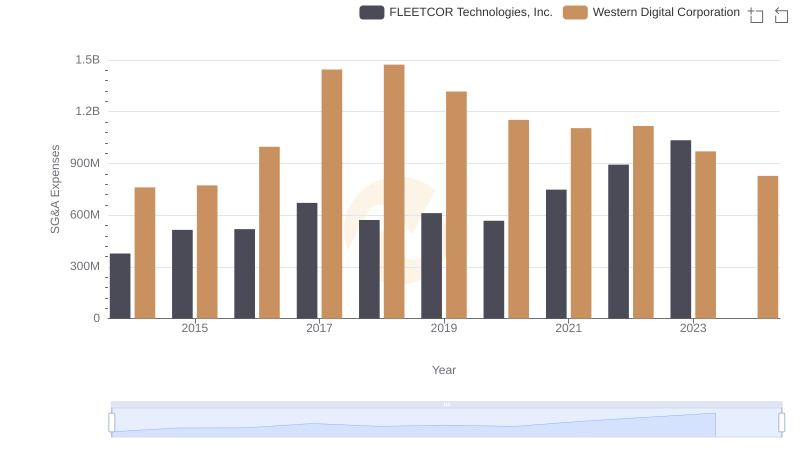
Cost Management Insights: SG&A Expenses for Western Digital Corporation and FLEETCOR Technologies, Inc.