| __timestamp | Pool Corporation | Waste Management, Inc. |
|---|---|---|
| Wednesday, January 1, 2014 | 643340000 | 4994000000 |
| Thursday, January 1, 2015 | 675644000 | 4730000000 |
| Friday, January 1, 2016 | 741087000 | 5123000000 |
| Sunday, January 1, 2017 | 805289000 | 5464000000 |
| Monday, January 1, 2018 | 870173000 | 5665000000 |
| Tuesday, January 1, 2019 | 924925000 | 5959000000 |
| Wednesday, January 1, 2020 | 1130902000 | 5877000000 |
| Friday, January 1, 2021 | 1617092000 | 6820000000 |
| Saturday, January 1, 2022 | 1933412000 | 7404000000 |
| Sunday, January 1, 2023 | 1660044000 | 7820000000 |
| Monday, January 1, 2024 | 8680000000 |
Cracking the code
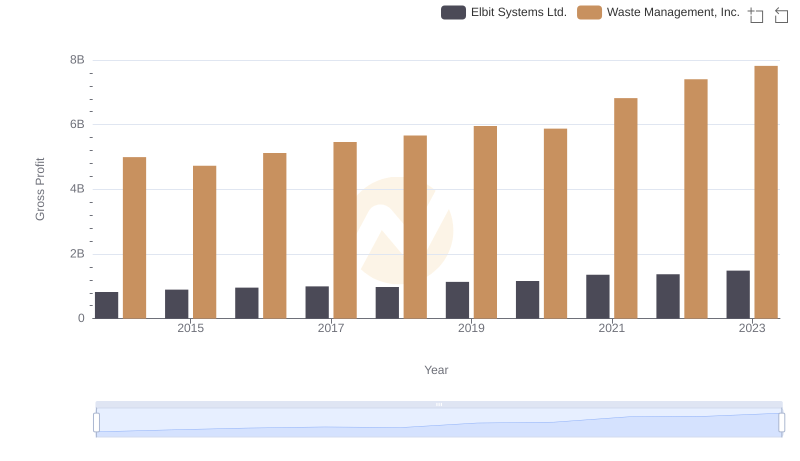
In the past decade, Waste Management, Inc. and Pool Corporation have showcased intriguing trends in their gross profit margins. Waste Management, a leader in environmental services, has consistently outperformed Pool Corporation, a major player in the pool supply industry. From 2014 to 2023, Waste Management's gross profit surged by approximately 57%, peaking in 2023 with a remarkable $7.82 billion. In contrast, Pool Corporation experienced a robust growth of around 158%, reaching its highest gross profit of $1.93 billion in 2022. Despite Pool Corporation's impressive growth rate, Waste Management's gross profit remains significantly higher, underscoring its dominant market position. This comparison highlights the diverse growth trajectories of two distinct industries, reflecting broader economic trends and consumer behaviors. As we look to the future, these companies' strategies will be pivotal in shaping their financial landscapes.
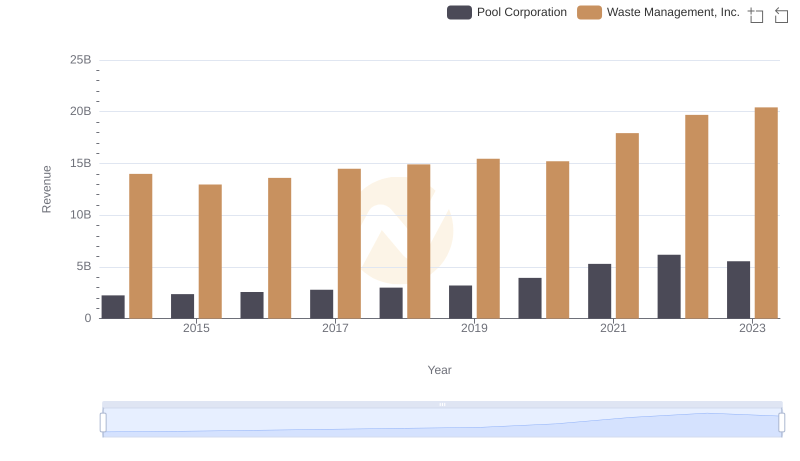
Annual Revenue Comparison: Waste Management, Inc. vs Pool Corporation
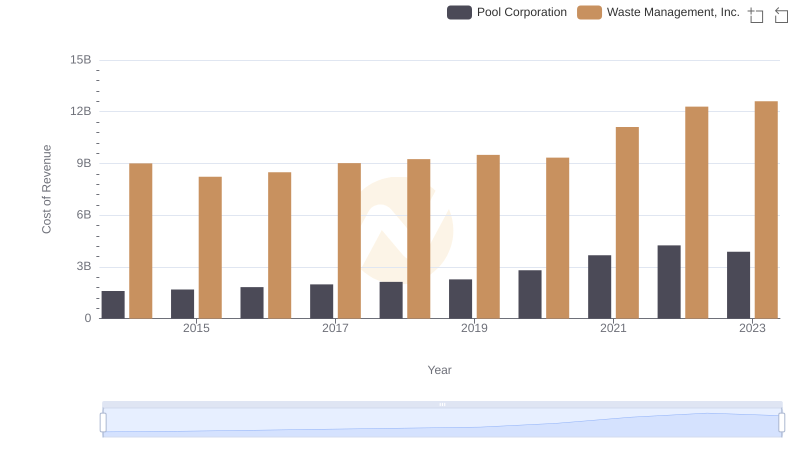
Cost Insights: Breaking Down Waste Management, Inc. and Pool Corporation's Expenses
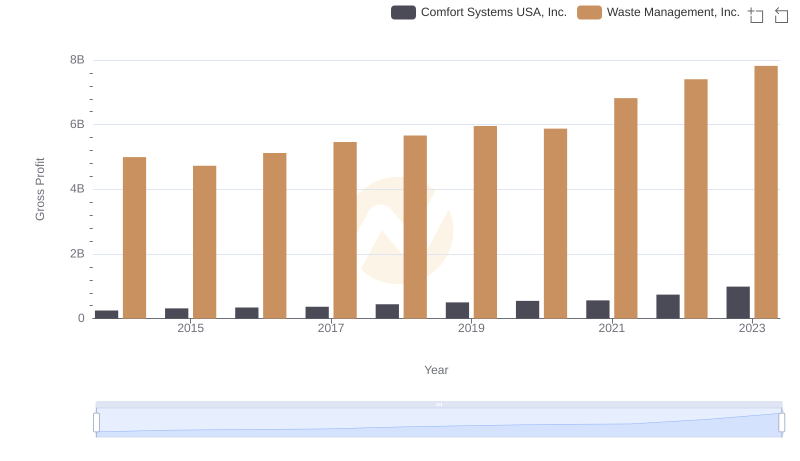
Who Generates Higher Gross Profit? Waste Management, Inc. or Comfort Systems USA, Inc.
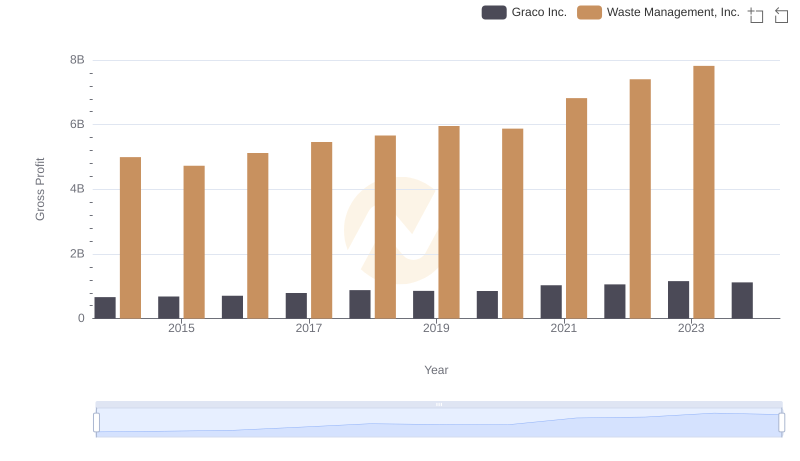
Gross Profit Analysis: Comparing Waste Management, Inc. and Graco Inc.
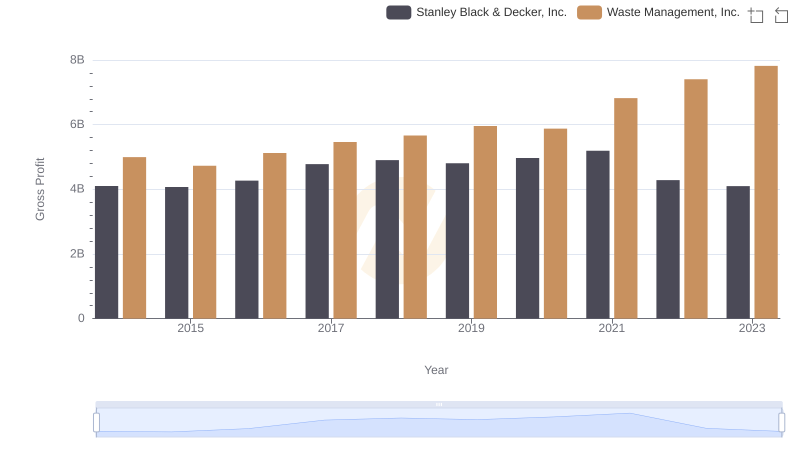
Gross Profit Analysis: Comparing Waste Management, Inc. and Stanley Black & Decker, Inc.
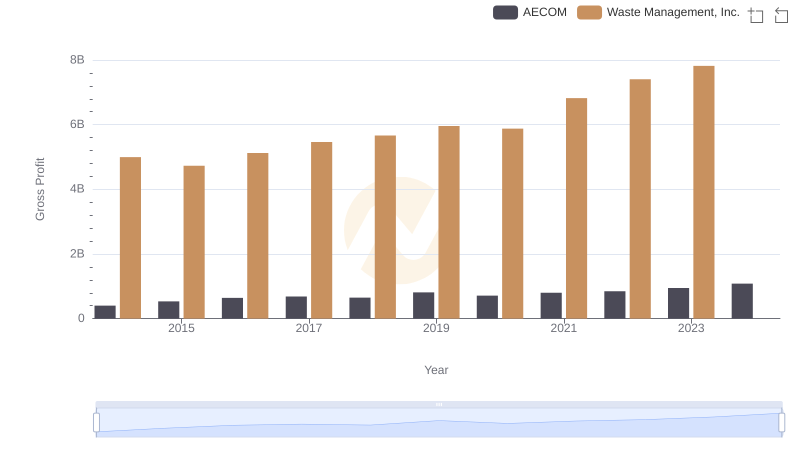
Waste Management, Inc. vs AECOM: A Gross Profit Performance Breakdown
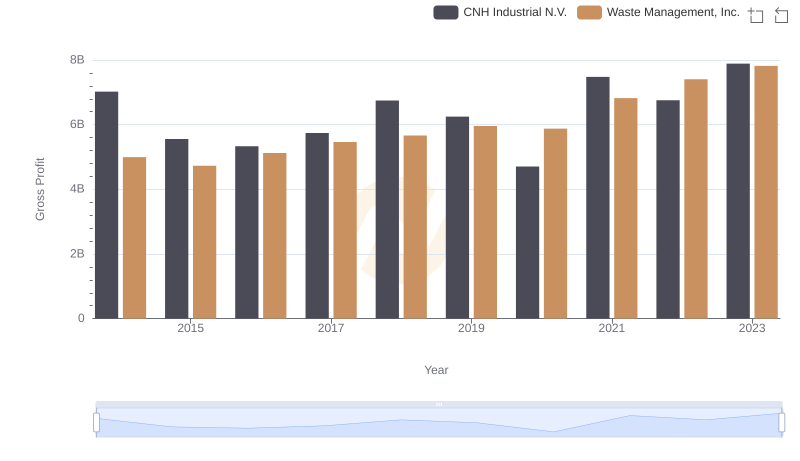
Gross Profit Trends Compared: Waste Management, Inc. vs CNH Industrial N.V.
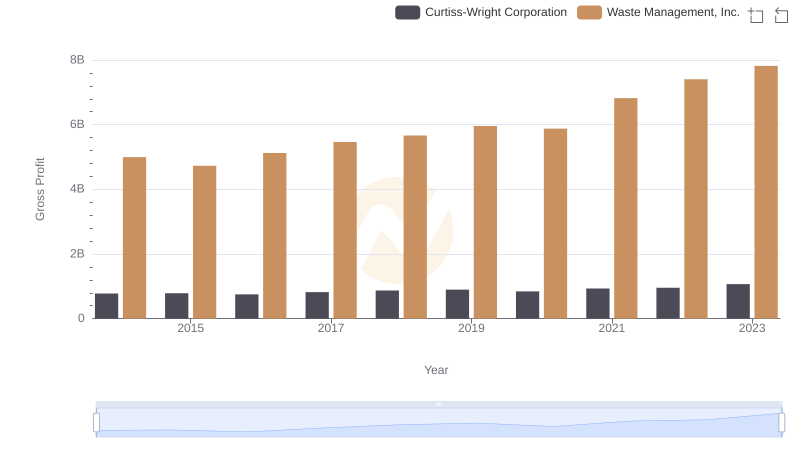
Key Insights on Gross Profit: Waste Management, Inc. vs Curtiss-Wright Corporation
Key Insights on Gross Profit: Waste Management, Inc. vs Elbit Systems Ltd.