| __timestamp | Eaton Corporation plc | HEICO Corporation |
|---|---|---|
| Wednesday, January 1, 2014 | 6906000000 | 398312000 |
| Thursday, January 1, 2015 | 6563000000 | 434179000 |
| Friday, January 1, 2016 | 6347000000 | 515492000 |
| Sunday, January 1, 2017 | 6648000000 | 574725000 |
| Monday, January 1, 2018 | 7098000000 | 690715000 |
| Tuesday, January 1, 2019 | 7052000000 | 813840000 |
| Wednesday, January 1, 2020 | 5450000000 | 682127000 |
| Friday, January 1, 2021 | 6335000000 | 727423000 |
| Saturday, January 1, 2022 | 6887000000 | 862759000 |
| Sunday, January 1, 2023 | 8433000000 | 1153488000 |
| Monday, January 1, 2024 | 9503000000 | 1501726000 |
In pursuit of knowledge
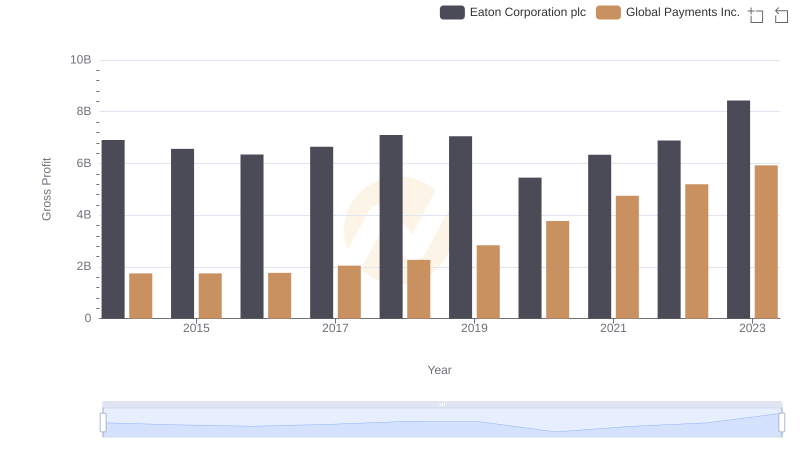
In the competitive landscape of industrial manufacturing, Eaton Corporation plc and HEICO Corporation have shown distinct trajectories in their gross profit over the past decade. From 2014 to 2023, Eaton's gross profit has seen a steady increase, peaking in 2023 with a remarkable 22% rise from its 2014 figures. This growth underscores Eaton's robust market strategies and operational efficiencies.
Conversely, HEICO Corporation, while starting with a lower gross profit, has demonstrated impressive growth, particularly in recent years. By 2023, HEICO's gross profit surged by nearly 190% compared to 2014, reflecting its dynamic expansion and innovation in aerospace and electronics.
The data for 2024 is incomplete for Eaton, but HEICO continues its upward trend, suggesting a promising future. These insights highlight the evolving dynamics and competitive strategies within the industrial sector.