| __timestamp | CSX Corporation | XPO Logistics, Inc. |
|---|---|---|
| Wednesday, January 1, 2014 | 3613000000 | 381600000 |
| Thursday, January 1, 2015 | 3584000000 | 1084800000 |
| Friday, January 1, 2016 | 3389000000 | 2139300000 |
| Sunday, January 1, 2017 | 3773000000 | 2279700000 |
| Monday, January 1, 2018 | 4773000000 | 2541000000 |
| Tuesday, January 1, 2019 | 4874000000 | 2666000000 |
| Wednesday, January 1, 2020 | 4362000000 | 2563000000 |
| Friday, January 1, 2021 | 5140000000 | 1994000000 |
| Saturday, January 1, 2022 | 5785000000 | 1227000000 |
| Sunday, January 1, 2023 | 5527000000 | 770000000 |
| Monday, January 1, 2024 | 915000000 |
Cracking the code
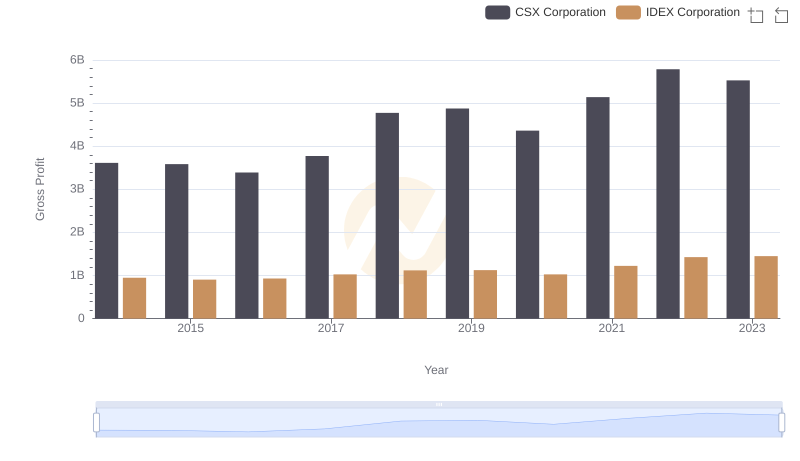
In the ever-evolving landscape of the transportation industry, CSX Corporation and XPO Logistics, Inc. have emerged as key players. Over the past decade, CSX Corporation has consistently outperformed XPO Logistics in terms of gross profit. From 2014 to 2023, CSX's gross profit surged by approximately 53%, peaking in 2022. In contrast, XPO Logistics experienced a more volatile journey, with its gross profit peaking in 2019 before declining by about 71% by 2023.
The data reveals a compelling narrative of growth and resilience. CSX's steady climb reflects its strategic investments and operational efficiencies, while XPO's fluctuations highlight the challenges and opportunities in the logistics sector. As the industry continues to adapt to global demands, these trends offer valuable insights into the financial health and strategic direction of these two industry leaders.