| __timestamp | FLEETCOR Technologies, Inc. | Fidelity National Information Services, Inc. |
|---|---|---|
| Wednesday, January 1, 2014 | 377744000 | 810500000 |
| Thursday, January 1, 2015 | 515047000 | 1102800000 |
| Friday, January 1, 2016 | 519413000 | 1710000000 |
| Sunday, January 1, 2017 | 671544000 | 1442000000 |
| Monday, January 1, 2018 | 571765000 | 1301000000 |
| Tuesday, January 1, 2019 | 612016000 | 2667000000 |
| Wednesday, January 1, 2020 | 567410000 | 3516000000 |
| Friday, January 1, 2021 | 747948000 | 3938000000 |
| Saturday, January 1, 2022 | 893217000 | 4118000000 |
| Sunday, January 1, 2023 | 1034248000 | 2096000000 |
| Monday, January 1, 2024 | 997780000 | 2185000000 |
Unleashing insights
In the ever-evolving landscape of financial services, understanding the spending patterns of industry giants is crucial. Over the past decade, Fidelity National Information Services, Inc. (FIS) and FLEETCOR Technologies, Inc. have demonstrated distinct trajectories in their Selling, General, and Administrative (SG&A) expenses. From 2014 to 2023, FIS consistently outpaced FLEETCOR, with SG&A expenses peaking at approximately $4.1 billion in 2022, a staggering 400% increase from 2014. In contrast, FLEETCOR's expenses grew more modestly, reaching around $1 billion in 2023, marking a 174% rise over the same period. This divergence highlights FIS's aggressive expansion and investment strategies, while FLEETCOR maintains a more conservative approach. As the financial services sector continues to adapt to technological advancements and market demands, these spending patterns offer valuable insights into each company's strategic priorities and operational efficiencies.
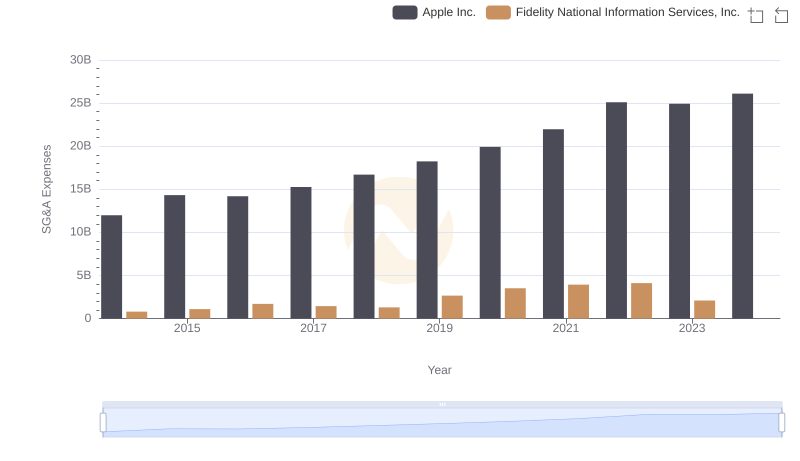
Apple Inc. and Fidelity National Information Services, Inc.: SG&A Spending Patterns Compared
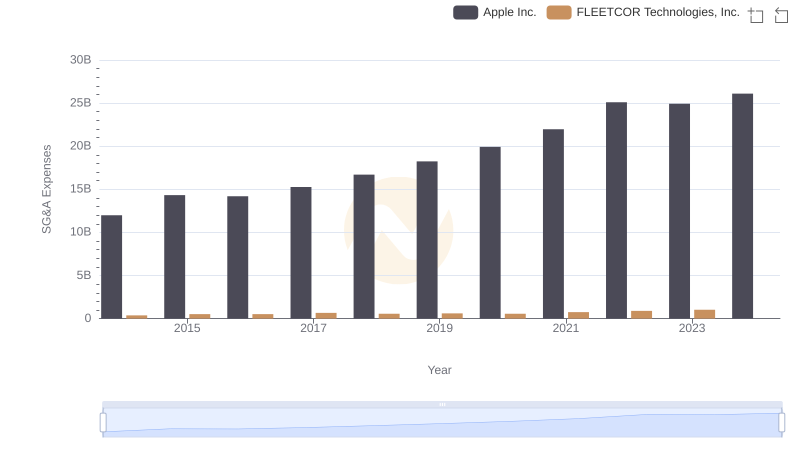
Who Optimizes SG&A Costs Better? Apple Inc. or FLEETCOR Technologies, Inc.
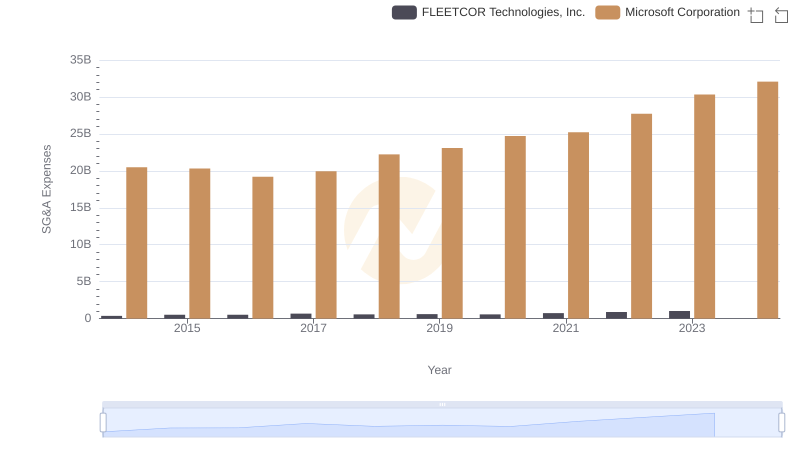
Microsoft Corporation vs FLEETCOR Technologies, Inc.: SG&A Expense Trends
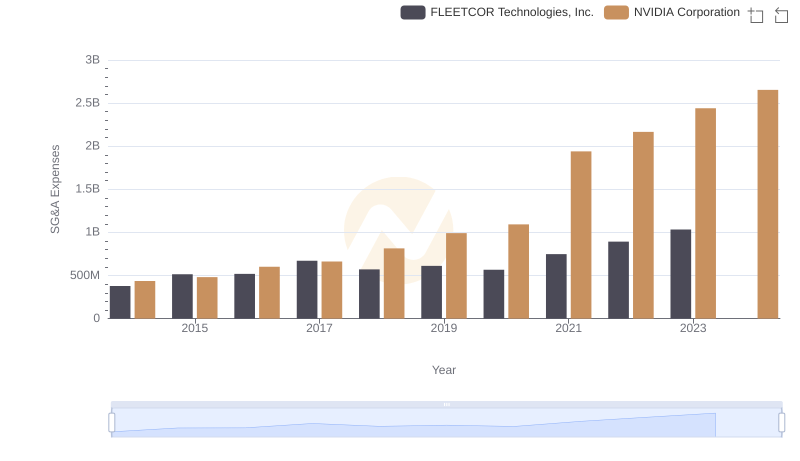
NVIDIA Corporation and FLEETCOR Technologies, Inc.: SG&A Spending Patterns Compared
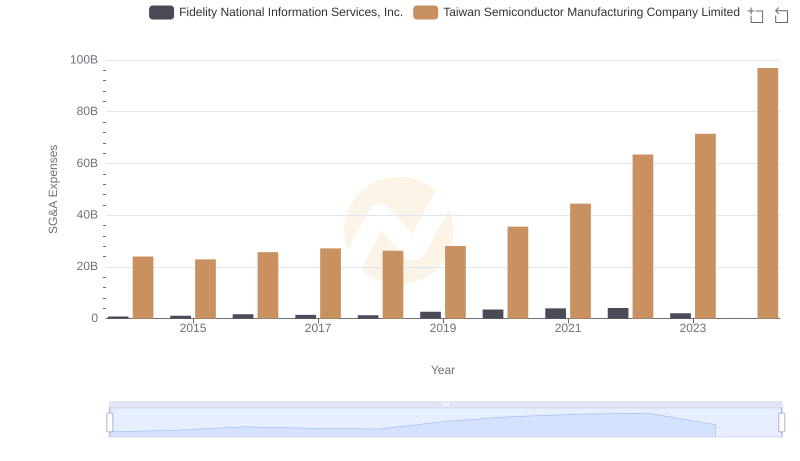
Cost Management Insights: SG&A Expenses for Taiwan Semiconductor Manufacturing Company Limited and Fidelity National Information Services, Inc.
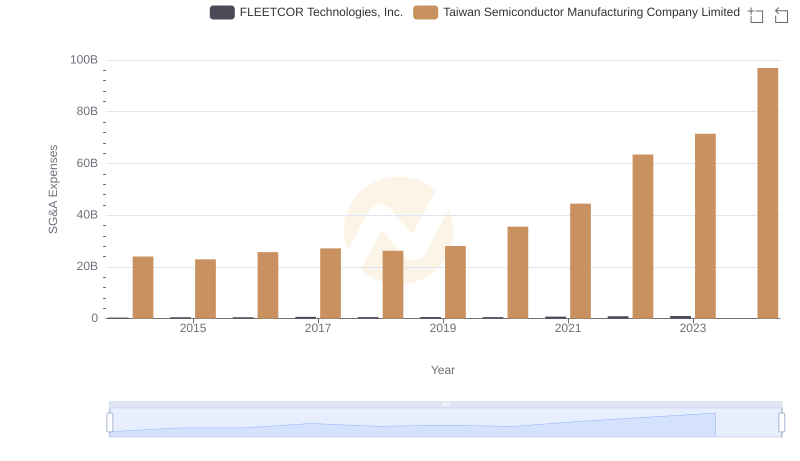
Taiwan Semiconductor Manufacturing Company Limited vs FLEETCOR Technologies, Inc.: SG&A Expense Trends
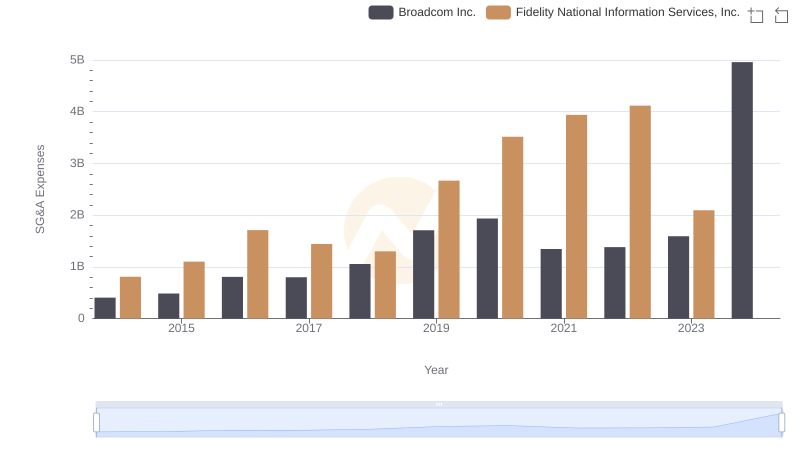
Comparing SG&A Expenses: Broadcom Inc. vs Fidelity National Information Services, Inc. Trends and Insights
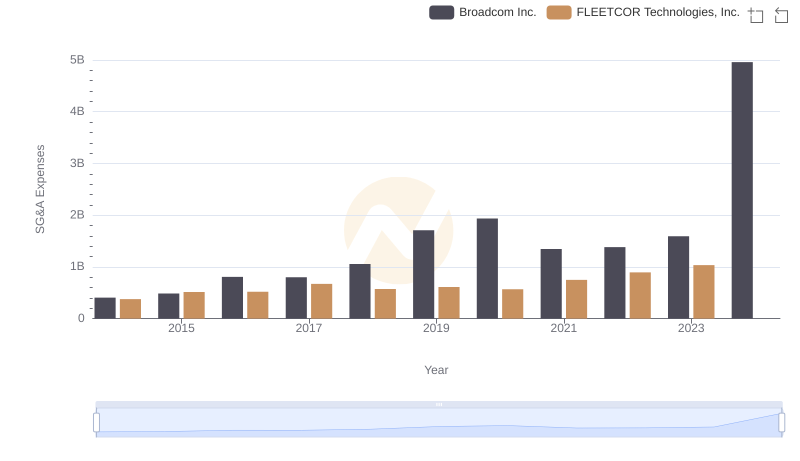
SG&A Efficiency Analysis: Comparing Broadcom Inc. and FLEETCOR Technologies, Inc.
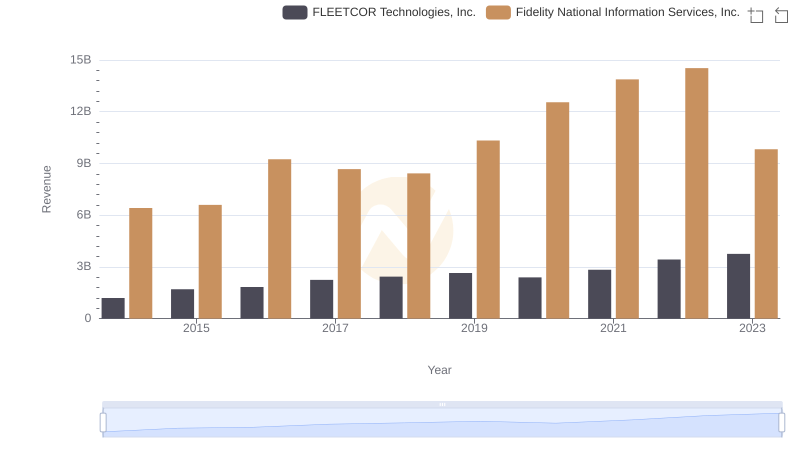
Fidelity National Information Services, Inc. vs FLEETCOR Technologies, Inc.: Examining Key Revenue Metrics
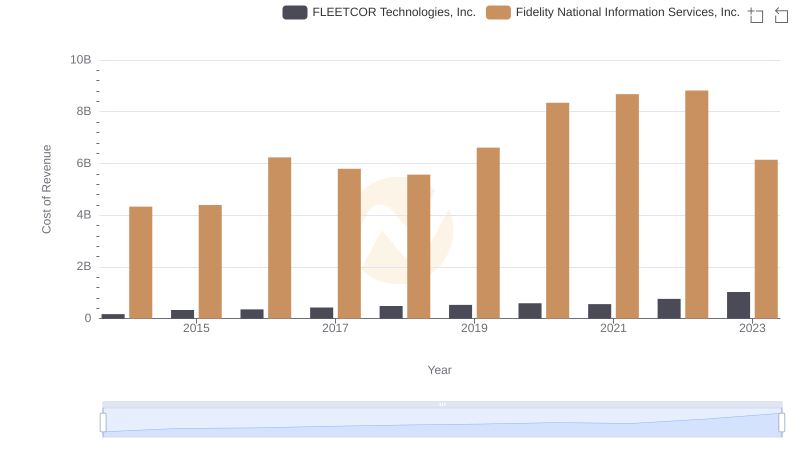
Cost of Revenue Comparison: Fidelity National Information Services, Inc. vs FLEETCOR Technologies, Inc.
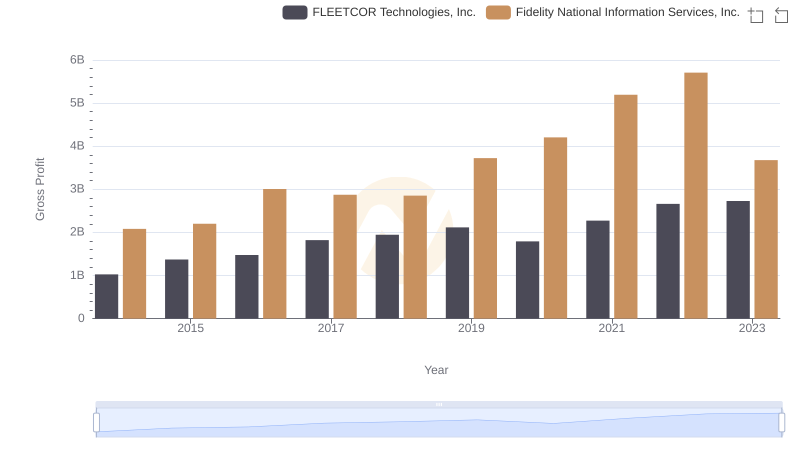
Who Generates Higher Gross Profit? Fidelity National Information Services, Inc. or FLEETCOR Technologies, Inc.
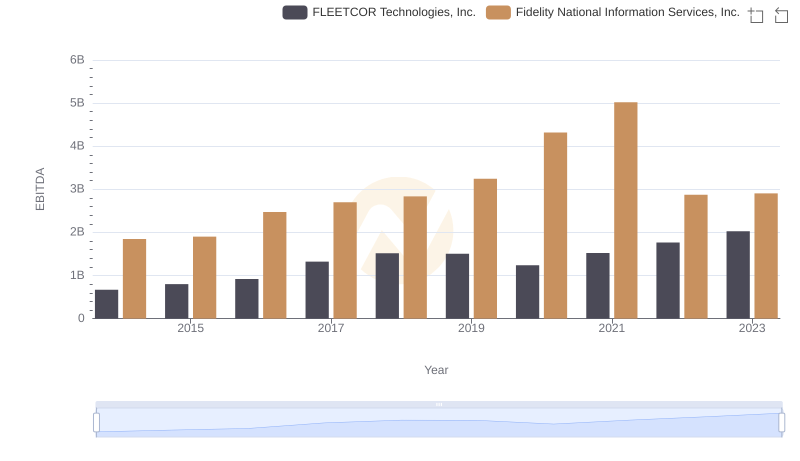
A Side-by-Side Analysis of EBITDA: Fidelity National Information Services, Inc. and FLEETCOR Technologies, Inc.