| __timestamp | FLEETCOR Technologies, Inc. | Fidelity National Information Services, Inc. |
|---|---|---|
| Wednesday, January 1, 2014 | 173337000 | 4332700000 |
| Thursday, January 1, 2015 | 331073000 | 4393200000 |
| Friday, January 1, 2016 | 355414000 | 6233000000 |
| Sunday, January 1, 2017 | 429613000 | 5794000000 |
| Monday, January 1, 2018 | 487695000 | 5569000000 |
| Tuesday, January 1, 2019 | 530669000 | 6610000000 |
| Wednesday, January 1, 2020 | 596363000 | 8348000000 |
| Friday, January 1, 2021 | 559819000 | 8682000000 |
| Saturday, January 1, 2022 | 764707000 | 8820000000 |
| Sunday, January 1, 2023 | 1030138999 | 6145000000 |
| Monday, January 1, 2024 | 0 | 6323000000 |
Cracking the code
In the ever-evolving landscape of financial services, understanding cost structures is pivotal. Over the past decade, Fidelity National Information Services, Inc. (FIS) and FLEETCOR Technologies, Inc. have showcased contrasting trajectories in their cost of revenue. From 2014 to 2023, FIS consistently maintained a higher cost of revenue, peaking in 2022 with a staggering 8.82 billion USD. This represents a 104% increase from 2014, highlighting their expansive operational scale. In contrast, FLEETCOR's cost of revenue, while significantly lower, surged by 495% over the same period, reaching 1.03 billion USD in 2023. This rapid growth underscores FLEETCOR's aggressive market expansion. The data reveals a compelling narrative of two industry giants navigating their financial strategies amidst changing market dynamics. As we delve deeper into these trends, the insights gleaned offer a window into the strategic priorities shaping the future of financial services.
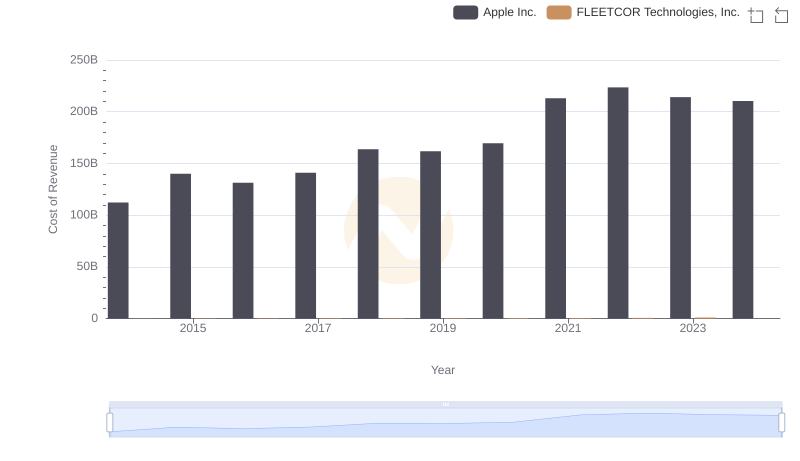
Apple Inc. vs FLEETCOR Technologies, Inc.: Efficiency in Cost of Revenue Explored
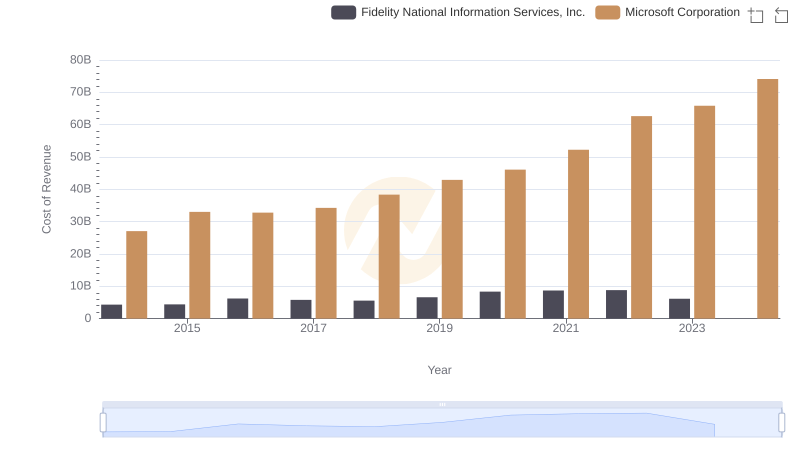
Cost of Revenue Trends: Microsoft Corporation vs Fidelity National Information Services, Inc.
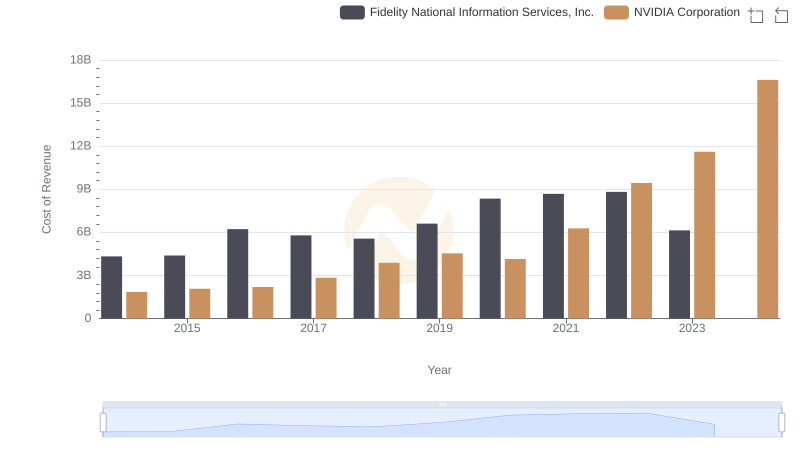
Cost of Revenue Trends: NVIDIA Corporation vs Fidelity National Information Services, Inc.
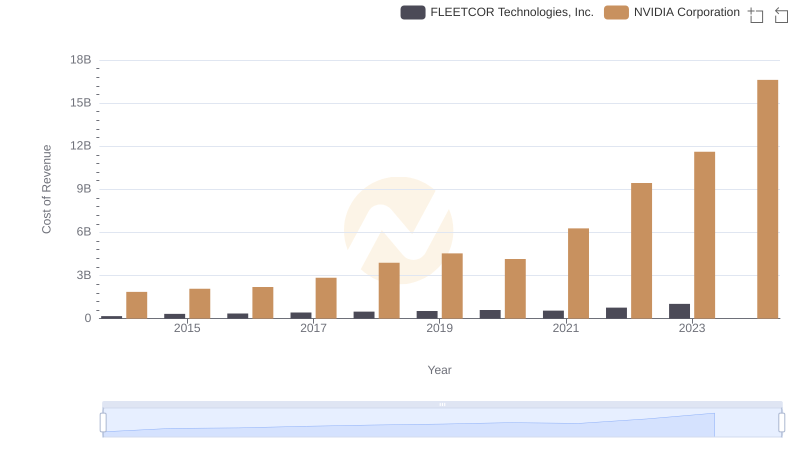
Cost Insights: Breaking Down NVIDIA Corporation and FLEETCOR Technologies, Inc.'s Expenses
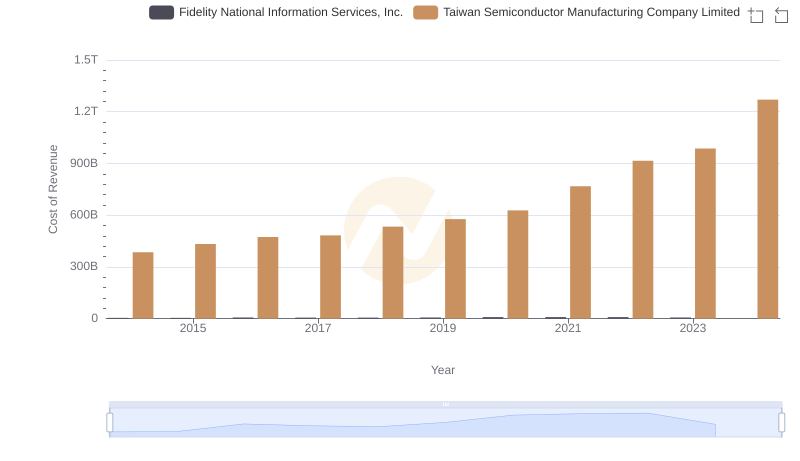
Cost Insights: Breaking Down Taiwan Semiconductor Manufacturing Company Limited and Fidelity National Information Services, Inc.'s Expenses
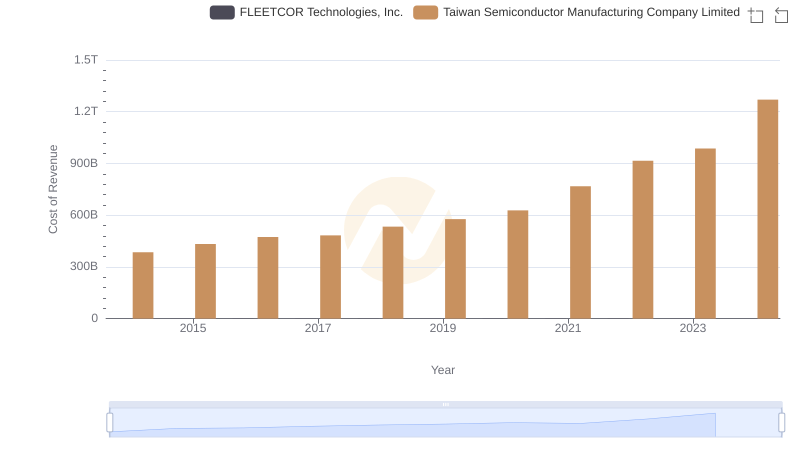
Cost of Revenue Comparison: Taiwan Semiconductor Manufacturing Company Limited vs FLEETCOR Technologies, Inc.
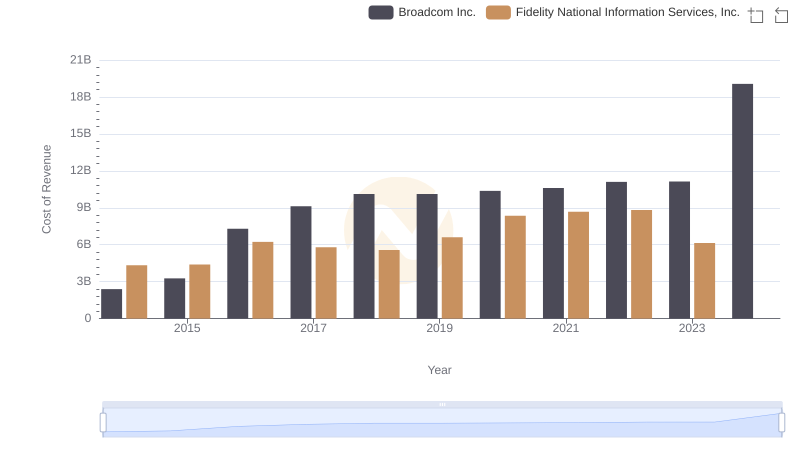
Comparing Cost of Revenue Efficiency: Broadcom Inc. vs Fidelity National Information Services, Inc.
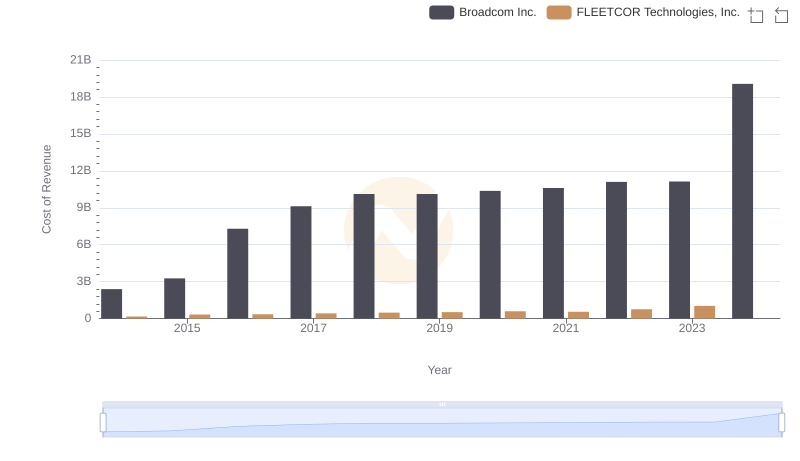
Broadcom Inc. vs FLEETCOR Technologies, Inc.: Efficiency in Cost of Revenue Explored
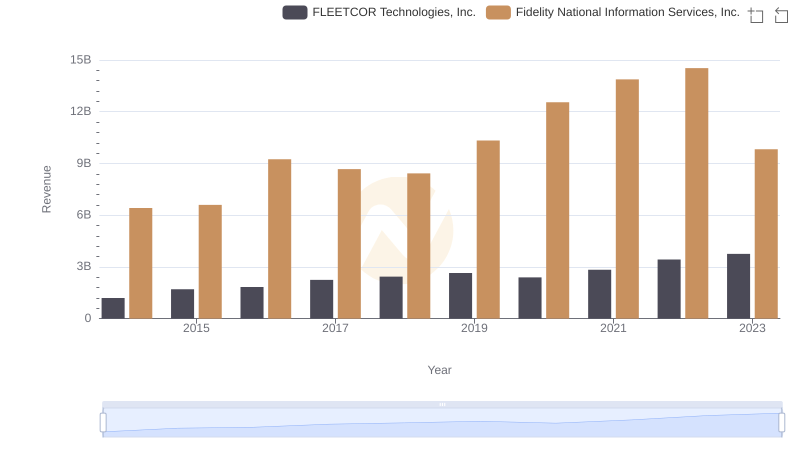
Fidelity National Information Services, Inc. vs FLEETCOR Technologies, Inc.: Examining Key Revenue Metrics
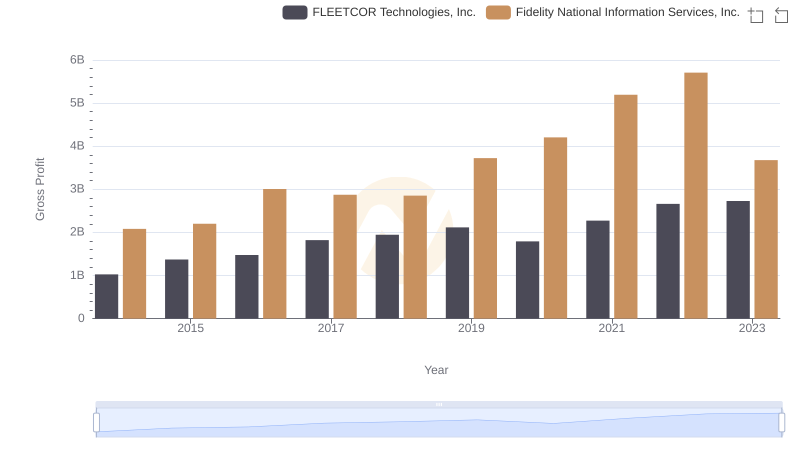
Who Generates Higher Gross Profit? Fidelity National Information Services, Inc. or FLEETCOR Technologies, Inc.
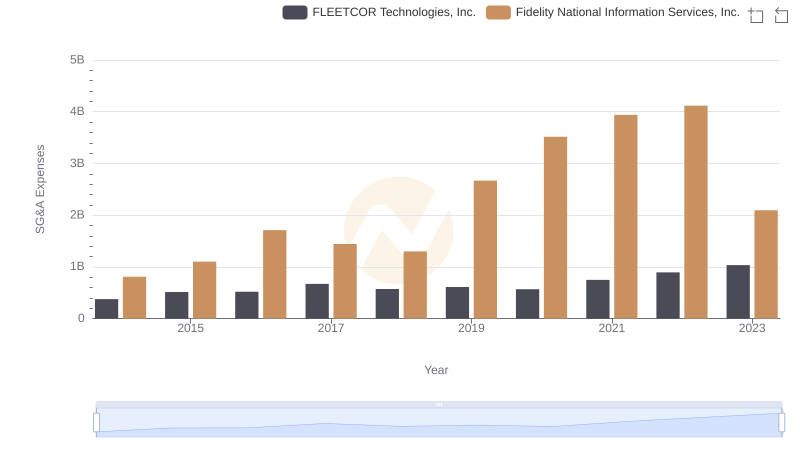
Fidelity National Information Services, Inc. and FLEETCOR Technologies, Inc.: SG&A Spending Patterns Compared
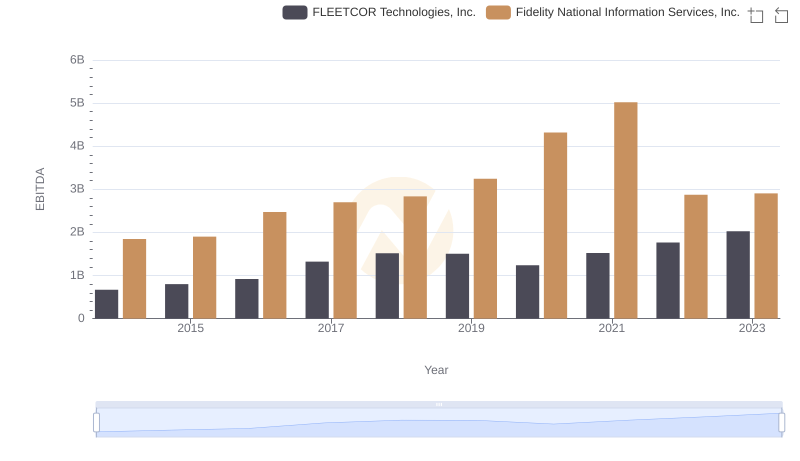
A Side-by-Side Analysis of EBITDA: Fidelity National Information Services, Inc. and FLEETCOR Technologies, Inc.