| __timestamp | FLEETCOR Technologies, Inc. | Fidelity National Information Services, Inc. |
|---|---|---|
| Wednesday, January 1, 2014 | 669924000 | 1846200000 |
| Thursday, January 1, 2015 | 800796000 | 1901000000 |
| Friday, January 1, 2016 | 918071000 | 2474000000 |
| Sunday, January 1, 2017 | 1321756000 | 2700000000 |
| Monday, January 1, 2018 | 1517473000 | 2837000000 |
| Tuesday, January 1, 2019 | 1505547000 | 3244000000 |
| Wednesday, January 1, 2020 | 1237122000 | 4319000000 |
| Friday, January 1, 2021 | 1522895000 | 5021000000 |
| Saturday, January 1, 2022 | 1765920000 | 2875000000 |
| Sunday, January 1, 2023 | 2027494000 | 2906000000 |
| Monday, January 1, 2024 | 2119258000 | 1709000000 |
Data in motion
In the ever-evolving landscape of financial services, two giants, Fidelity National Information Services, Inc. and FLEETCOR Technologies, Inc., have demonstrated remarkable EBITDA growth over the past decade. From 2014 to 2023, Fidelity National's EBITDA surged by approximately 57%, peaking in 2021 with a 172% increase from its 2014 figures. Meanwhile, FLEETCOR's EBITDA grew by an impressive 203% over the same period, showcasing its robust financial health.
This side-by-side analysis underscores the dynamic nature of the financial services sector, where strategic foresight and adaptability are key to sustained growth.
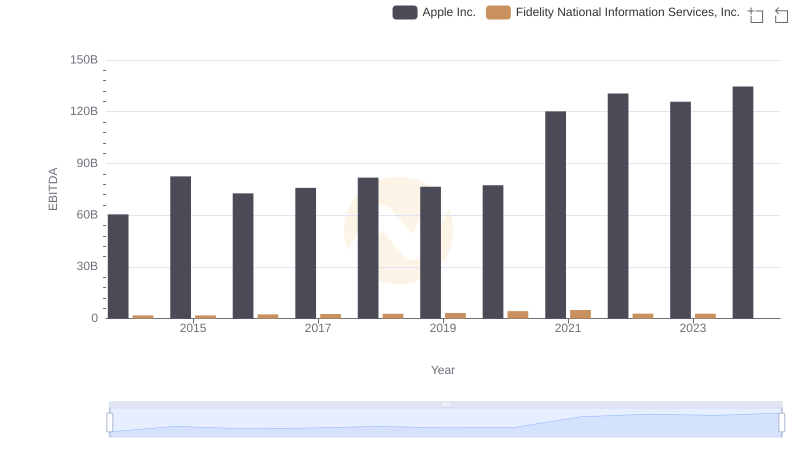
EBITDA Analysis: Evaluating Apple Inc. Against Fidelity National Information Services, Inc.
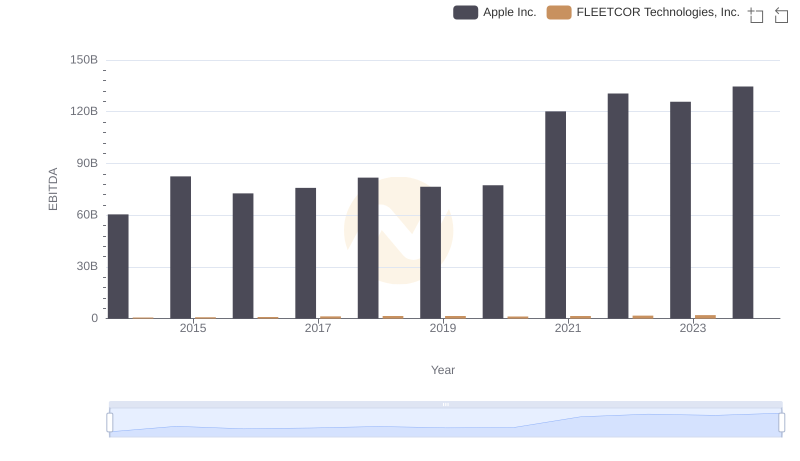
EBITDA Metrics Evaluated: Apple Inc. vs FLEETCOR Technologies, Inc.
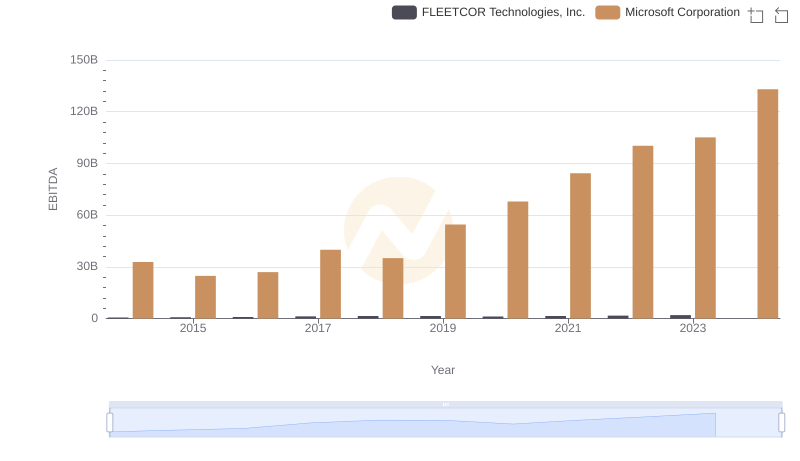
Microsoft Corporation vs FLEETCOR Technologies, Inc.: In-Depth EBITDA Performance Comparison
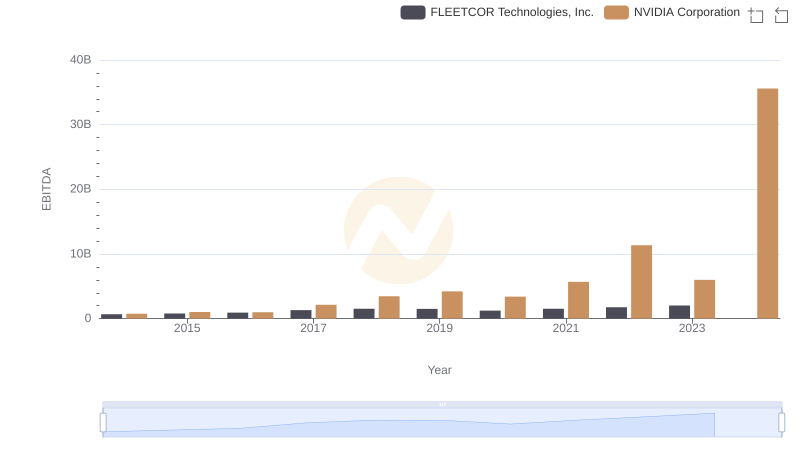
NVIDIA Corporation and FLEETCOR Technologies, Inc.: A Detailed Examination of EBITDA Performance
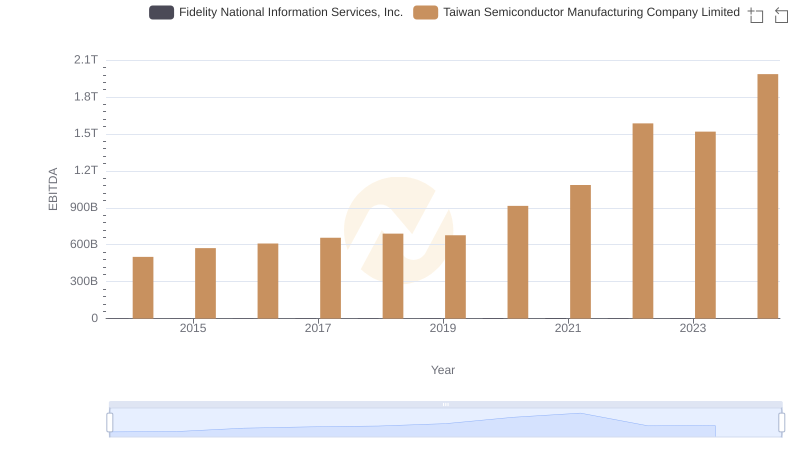
Taiwan Semiconductor Manufacturing Company Limited and Fidelity National Information Services, Inc.: A Detailed Examination of EBITDA Performance
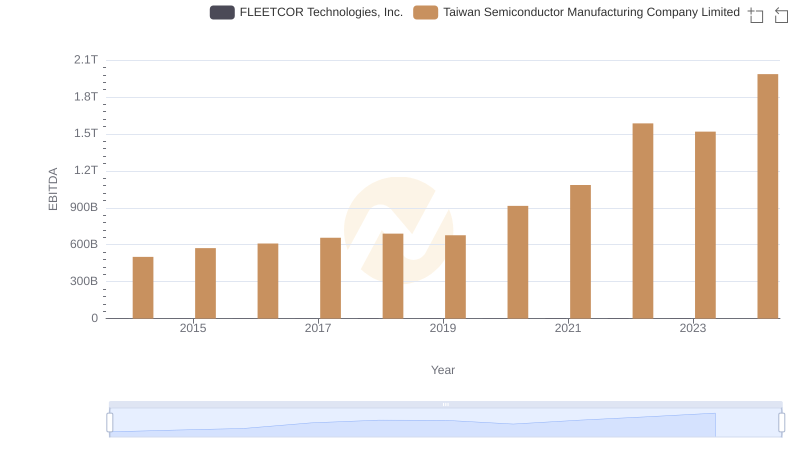
EBITDA Performance Review: Taiwan Semiconductor Manufacturing Company Limited vs FLEETCOR Technologies, Inc.
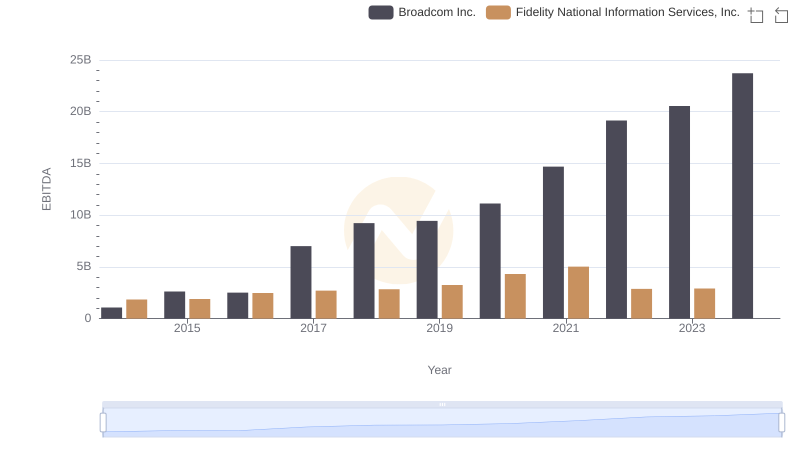
EBITDA Analysis: Evaluating Broadcom Inc. Against Fidelity National Information Services, Inc.
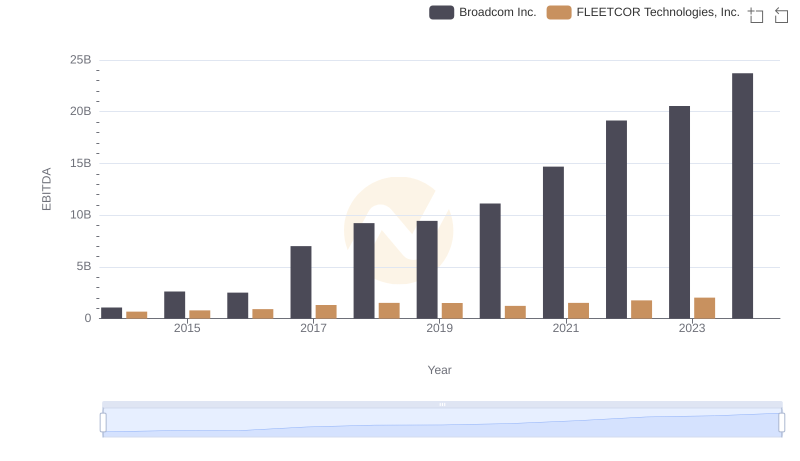
Comparative EBITDA Analysis: Broadcom Inc. vs FLEETCOR Technologies, Inc.
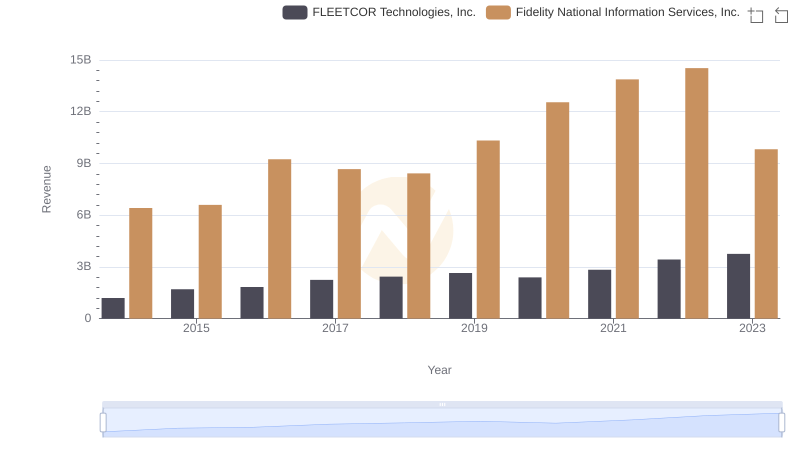
Fidelity National Information Services, Inc. vs FLEETCOR Technologies, Inc.: Examining Key Revenue Metrics
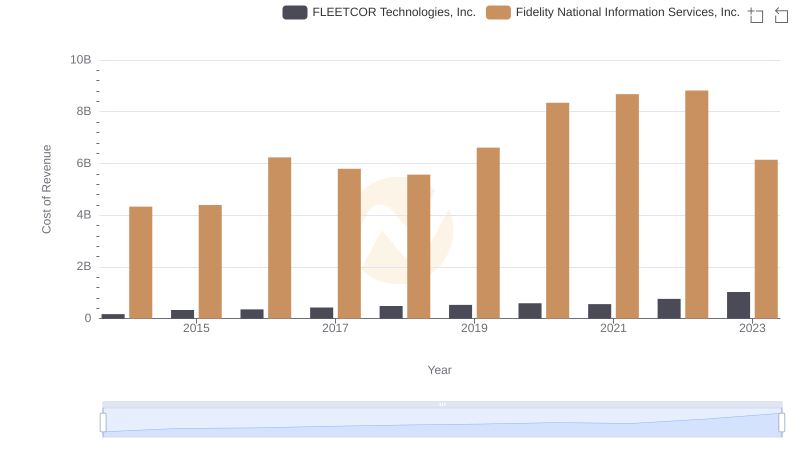
Cost of Revenue Comparison: Fidelity National Information Services, Inc. vs FLEETCOR Technologies, Inc.
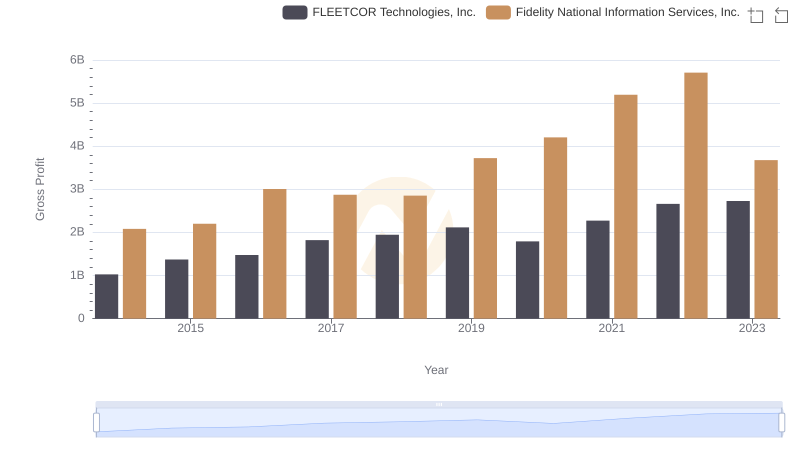
Who Generates Higher Gross Profit? Fidelity National Information Services, Inc. or FLEETCOR Technologies, Inc.
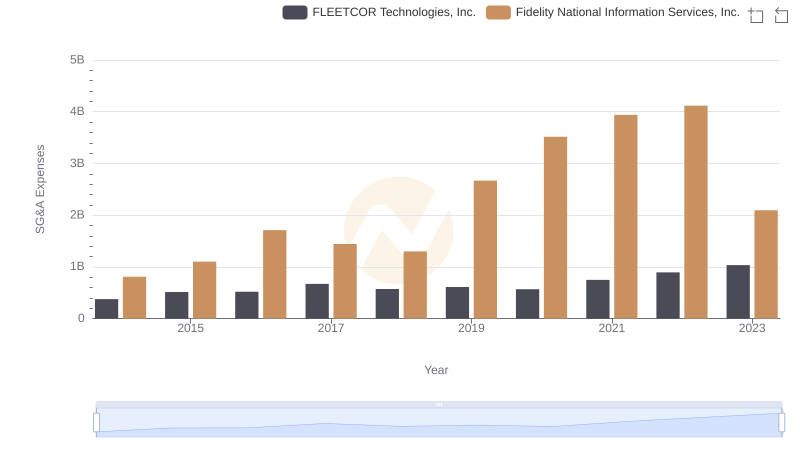
Fidelity National Information Services, Inc. and FLEETCOR Technologies, Inc.: SG&A Spending Patterns Compared