| __timestamp | Dover Corporation | Equifax Inc. |
|---|---|---|
| Wednesday, January 1, 2014 | 7752728000 | 2436400000 |
| Thursday, January 1, 2015 | 6956311000 | 2663600000 |
| Friday, January 1, 2016 | 6794342000 | 3144900000 |
| Sunday, January 1, 2017 | 7830436000 | 3362200000 |
| Monday, January 1, 2018 | 6992118000 | 3412100000 |
| Tuesday, January 1, 2019 | 7136397000 | 3507600000 |
| Wednesday, January 1, 2020 | 6683760000 | 4127500000 |
| Friday, January 1, 2021 | 7907081000 | 4923900000 |
| Saturday, January 1, 2022 | 8508088000 | 5122200000 |
| Sunday, January 1, 2023 | 8438134000 | 5265200000 |
| Monday, January 1, 2024 | 7745909000 | 5681100000 |
Cracking the code
In the ever-evolving landscape of corporate finance, understanding revenue trends is crucial. Over the past decade, Equifax Inc. and Dover Corporation have showcased distinct growth trajectories. From 2014 to 2023, Dover Corporation's revenue fluctuated, peaking in 2022 with an impressive 13% increase from its 2014 figures. Meanwhile, Equifax Inc. demonstrated a robust upward trend, with revenue surging by over 116% during the same period, highlighting its strategic market positioning.
These insights offer a glimpse into the strategic maneuvers and market dynamics that have shaped these corporations' financial journeys over the past decade.
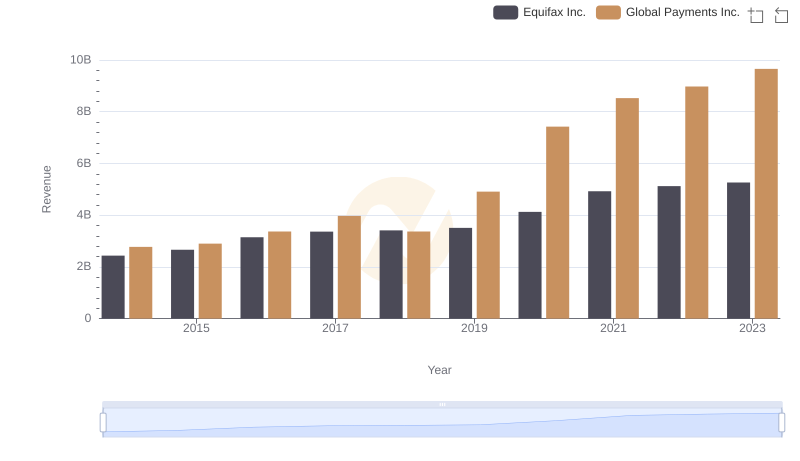
Comparing Revenue Performance: Equifax Inc. or Global Payments Inc.?
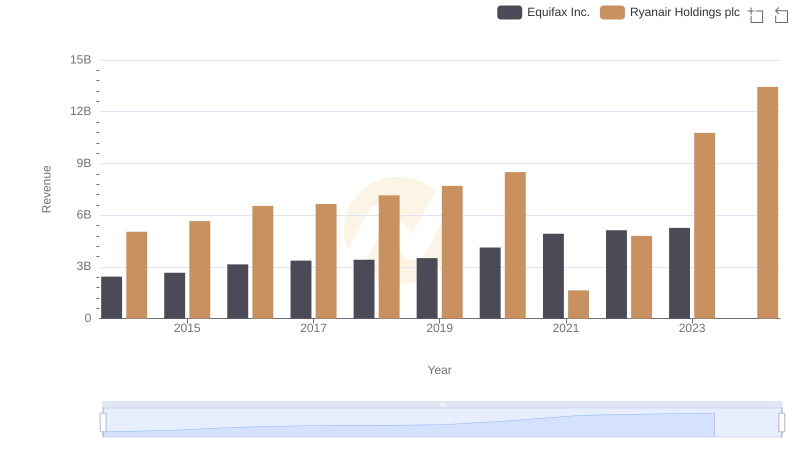
Revenue Showdown: Equifax Inc. vs Ryanair Holdings plc
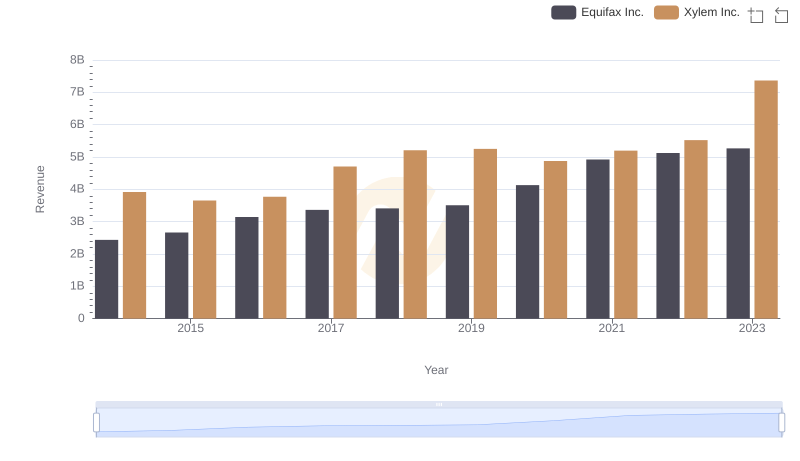
Annual Revenue Comparison: Equifax Inc. vs Xylem Inc.
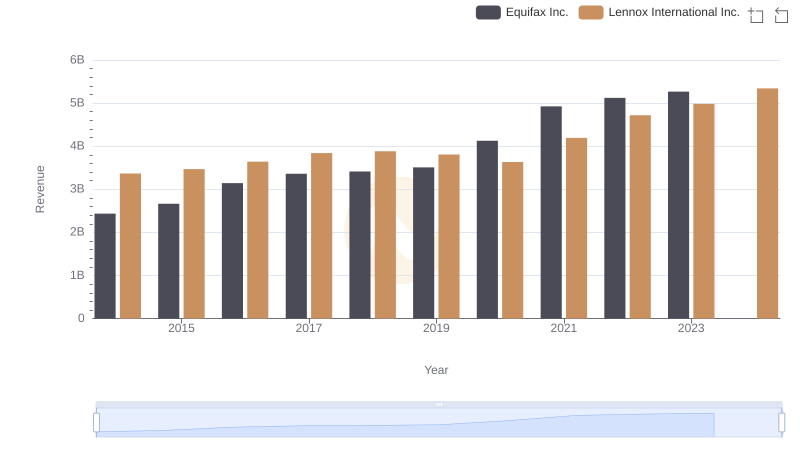
Annual Revenue Comparison: Equifax Inc. vs Lennox International Inc.
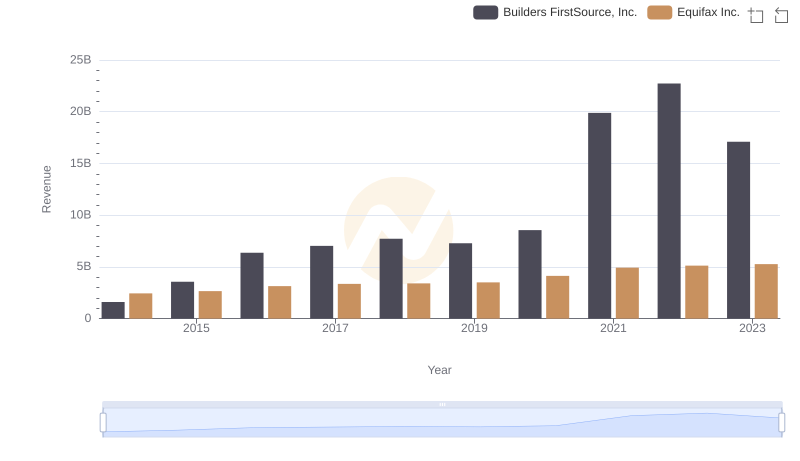
Annual Revenue Comparison: Equifax Inc. vs Builders FirstSource, Inc.
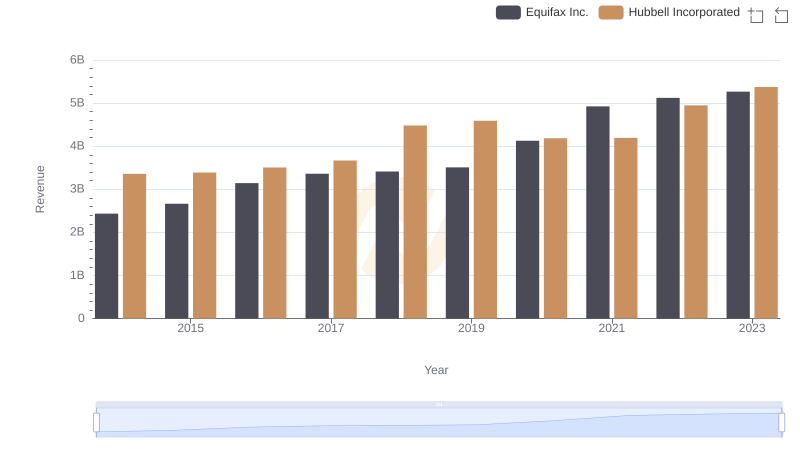
Breaking Down Revenue Trends: Equifax Inc. vs Hubbell Incorporated
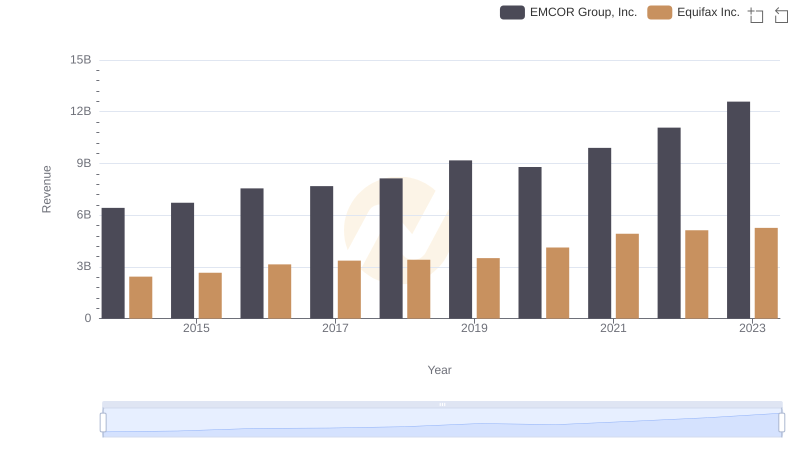
Breaking Down Revenue Trends: Equifax Inc. vs EMCOR Group, Inc.
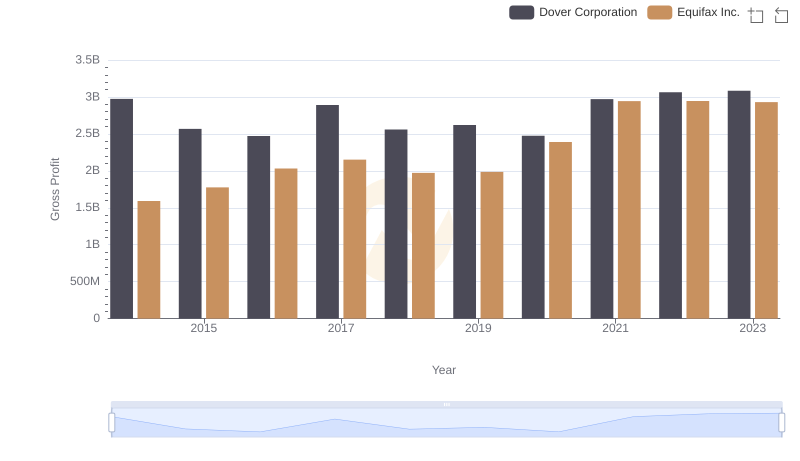
Equifax Inc. vs Dover Corporation: A Gross Profit Performance Breakdown