| __timestamp | Electronic Arts Inc. | PTC Inc. |
|---|---|---|
| Wednesday, January 1, 2014 | 2228000000 | 983284000 |
| Thursday, January 1, 2015 | 3086000000 | 920508000 |
| Friday, January 1, 2016 | 3042000000 | 814868000 |
| Sunday, January 1, 2017 | 3547000000 | 835020000 |
| Monday, January 1, 2018 | 3873000000 | 915630000 |
| Tuesday, January 1, 2019 | 3628000000 | 930253000 |
| Wednesday, January 1, 2020 | 4168000000 | 1124144000 |
| Friday, January 1, 2021 | 4135000000 | 1436057000 |
| Saturday, January 1, 2022 | 5132000000 | 1547367000 |
| Sunday, January 1, 2023 | 5634000000 | 1656047000 |
| Monday, January 1, 2024 | 5852000000 | 1811638000 |
In pursuit of knowledge
In the ever-evolving landscape of the tech industry, Electronic Arts Inc. (EA) and PTC Inc. have showcased remarkable growth in gross profit over the past decade. From 2014 to 2024, EA's gross profit surged by approximately 163%, reflecting its robust market strategies and expanding digital footprint. Meanwhile, PTC Inc. demonstrated a commendable growth of around 84%, driven by its innovative software solutions and strategic acquisitions.
This data underscores the dynamic nature of the tech industry, where strategic innovation and market adaptation are key to sustained growth.
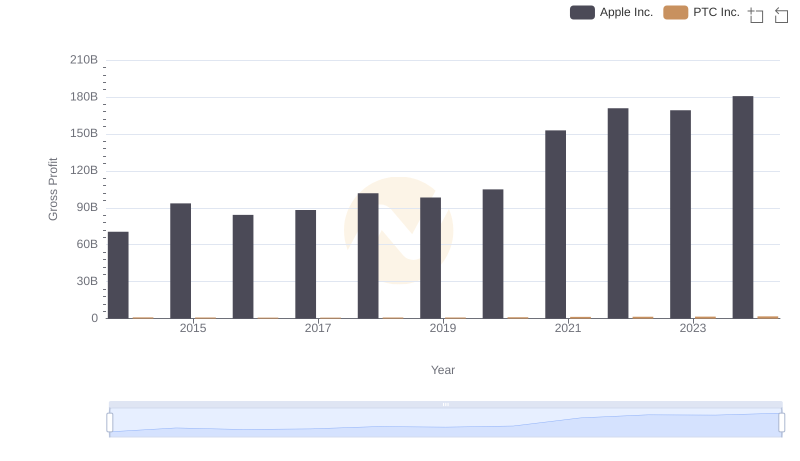
Gross Profit Comparison: Apple Inc. and PTC Inc. Trends
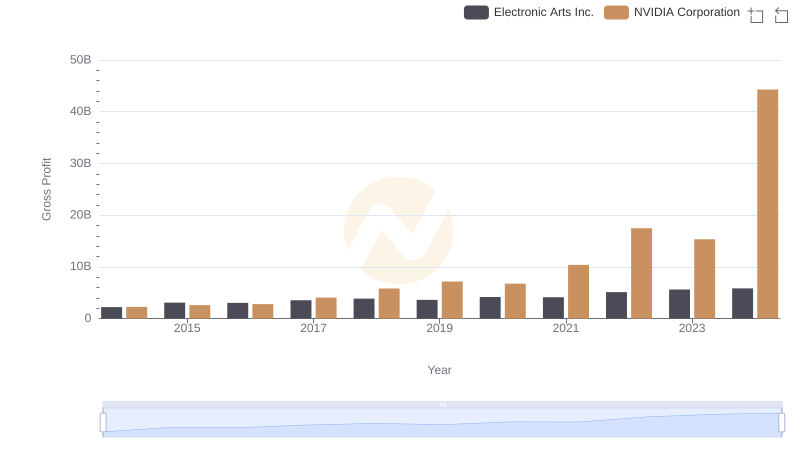
Gross Profit Comparison: NVIDIA Corporation and Electronic Arts Inc. Trends
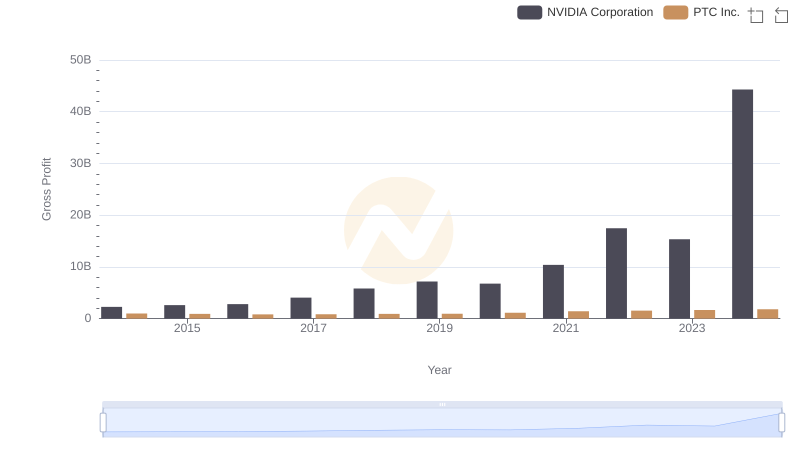
Gross Profit Comparison: NVIDIA Corporation and PTC Inc. Trends
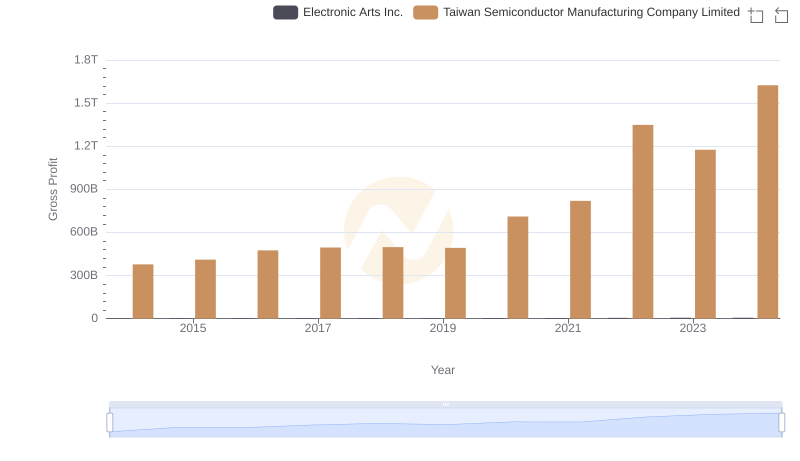
Gross Profit Analysis: Comparing Taiwan Semiconductor Manufacturing Company Limited and Electronic Arts Inc.
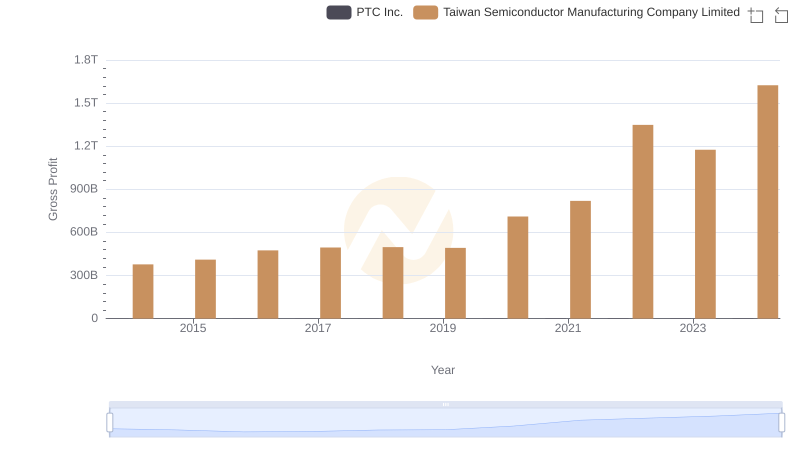
Key Insights on Gross Profit: Taiwan Semiconductor Manufacturing Company Limited vs PTC Inc.
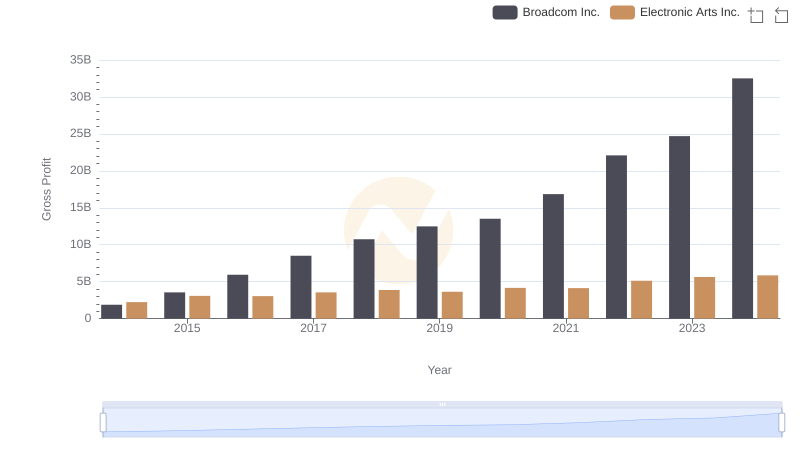
Gross Profit Analysis: Comparing Broadcom Inc. and Electronic Arts Inc.
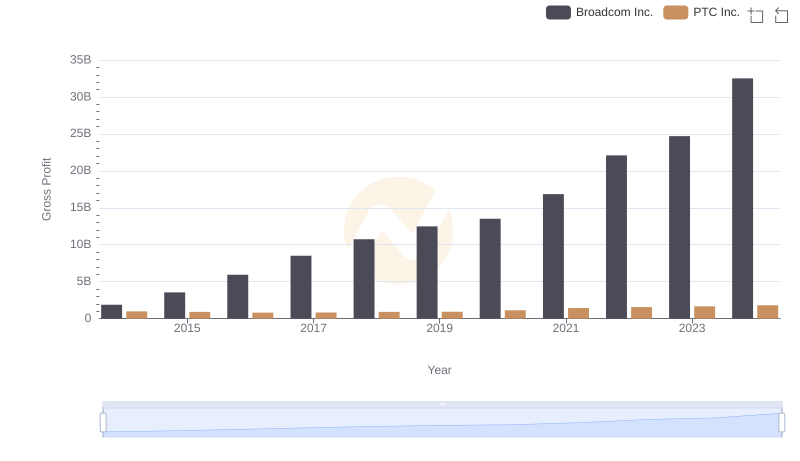
Broadcom Inc. and PTC Inc.: A Detailed Gross Profit Analysis
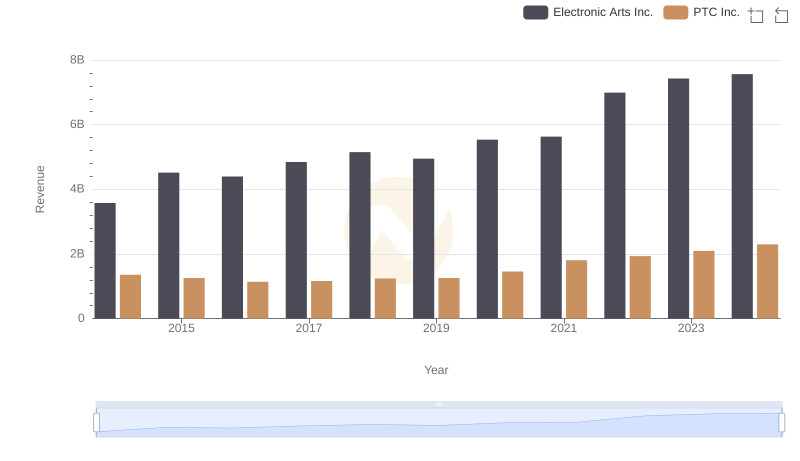
Electronic Arts Inc. and PTC Inc.: A Comprehensive Revenue Analysis
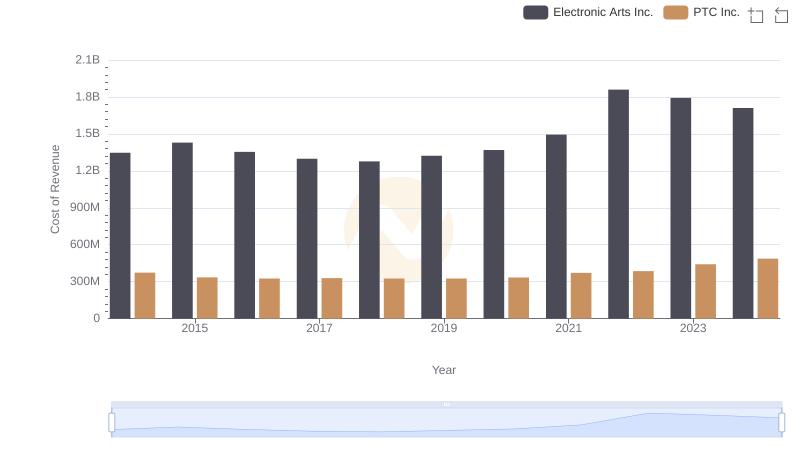
Cost Insights: Breaking Down Electronic Arts Inc. and PTC Inc.'s Expenses
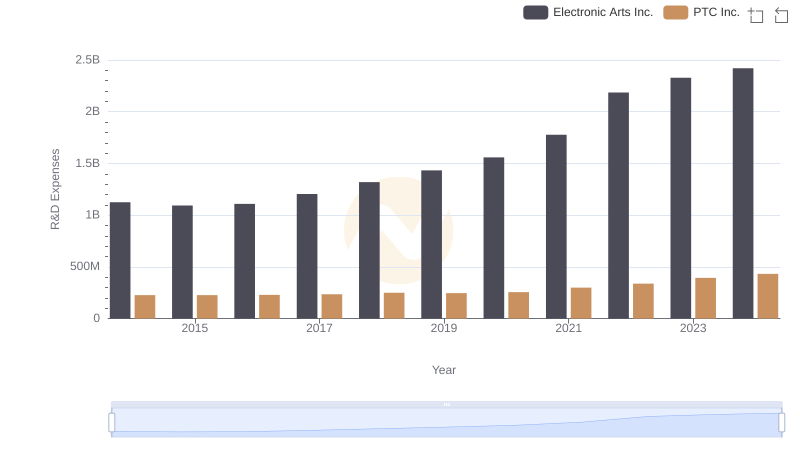
Comparing Innovation Spending: Electronic Arts Inc. and PTC Inc.
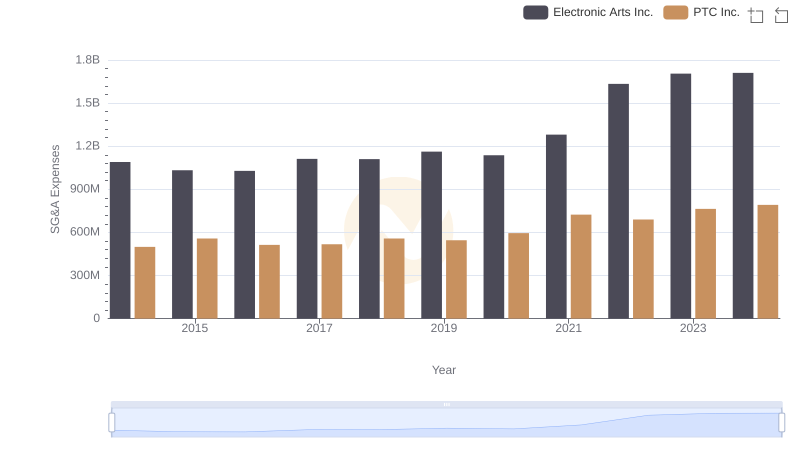
Who Optimizes SG&A Costs Better? Electronic Arts Inc. or PTC Inc.
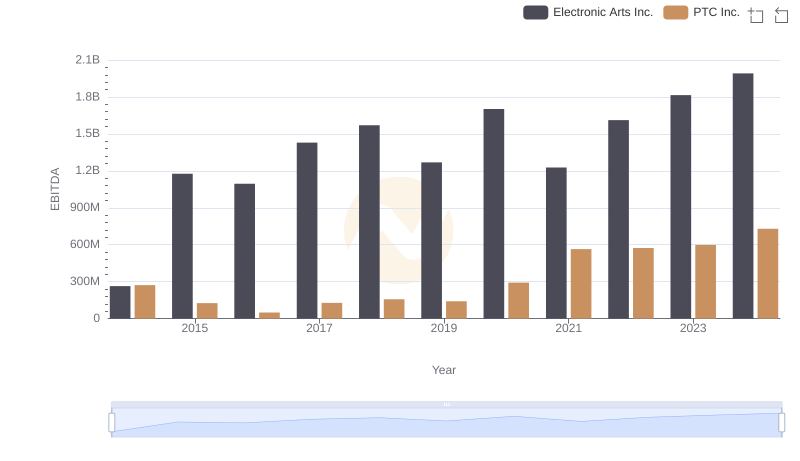
Comparative EBITDA Analysis: Electronic Arts Inc. vs PTC Inc.