| __timestamp | Electronic Arts Inc. | PTC Inc. |
|---|---|---|
| Wednesday, January 1, 2014 | 264000000 | 271574000 |
| Thursday, January 1, 2015 | 1176000000 | 125699999 |
| Friday, January 1, 2016 | 1095000000 | 49244000 |
| Sunday, January 1, 2017 | 1429000000 | 127736000 |
| Monday, January 1, 2018 | 1570000000 | 157737000 |
| Tuesday, January 1, 2019 | 1269000000 | 141171000 |
| Wednesday, January 1, 2020 | 1702000000 | 291951000 |
| Friday, January 1, 2021 | 1227000000 | 564767000 |
| Saturday, January 1, 2022 | 1612000000 | 573406000 |
| Sunday, January 1, 2023 | 1815000000 | 599145000 |
| Monday, January 1, 2024 | 1991000000 | 730022000 |
Igniting the spark of knowledge
In the ever-evolving landscape of the gaming and software industries, Electronic Arts Inc. (EA) and PTC Inc. have showcased intriguing financial trajectories over the past decade. From 2014 to 2024, EA's EBITDA has surged by an impressive 655%, reflecting its robust growth and strategic market positioning. In contrast, PTC Inc. has experienced a remarkable 169% increase, underscoring its steady expansion in the software sector.
This comparative analysis highlights the dynamic nature of these industry leaders, offering valuable insights for investors and enthusiasts alike.
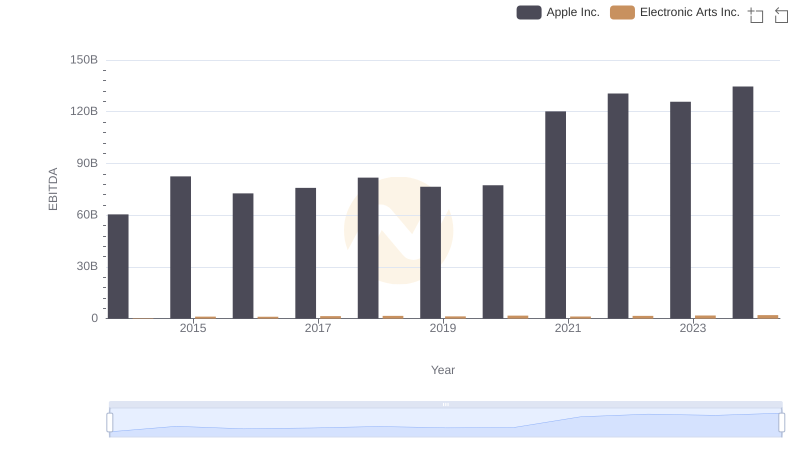
Apple Inc. vs Electronic Arts Inc.: In-Depth EBITDA Performance Comparison
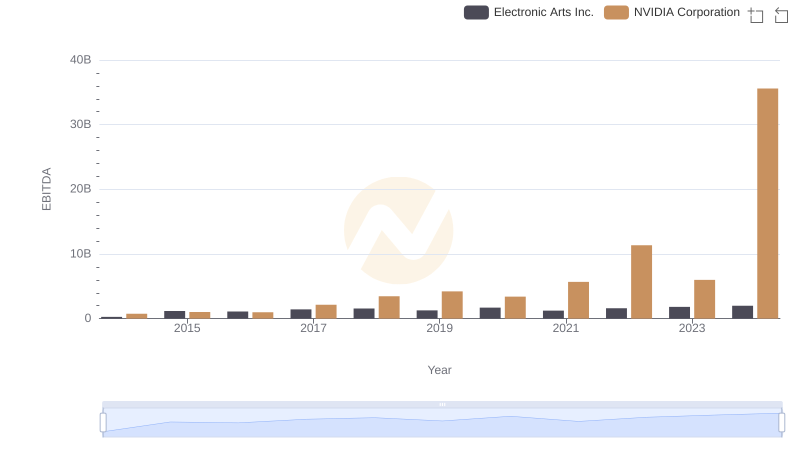
NVIDIA Corporation vs Electronic Arts Inc.: In-Depth EBITDA Performance Comparison
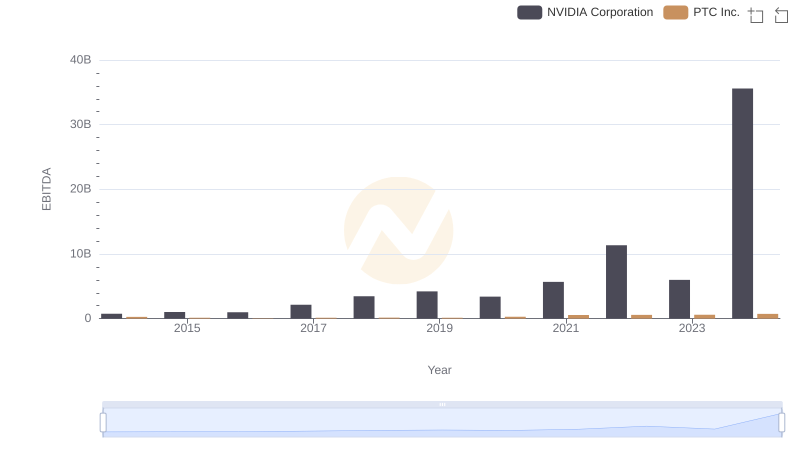
EBITDA Metrics Evaluated: NVIDIA Corporation vs PTC Inc.
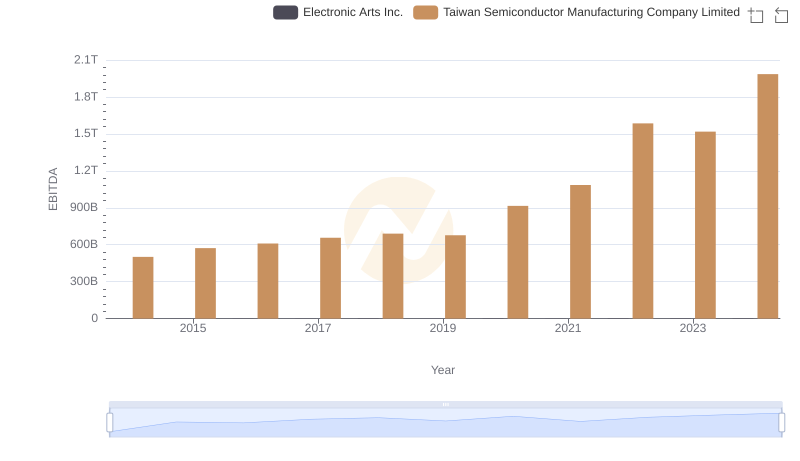
EBITDA Performance Review: Taiwan Semiconductor Manufacturing Company Limited vs Electronic Arts Inc.
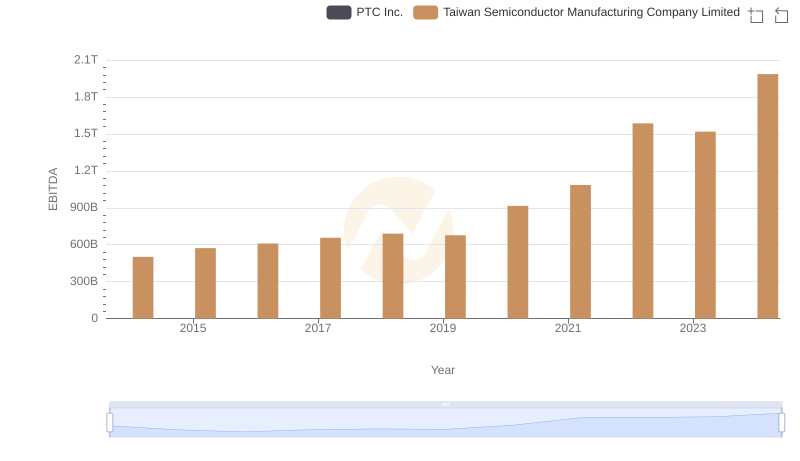
A Professional Review of EBITDA: Taiwan Semiconductor Manufacturing Company Limited Compared to PTC Inc.
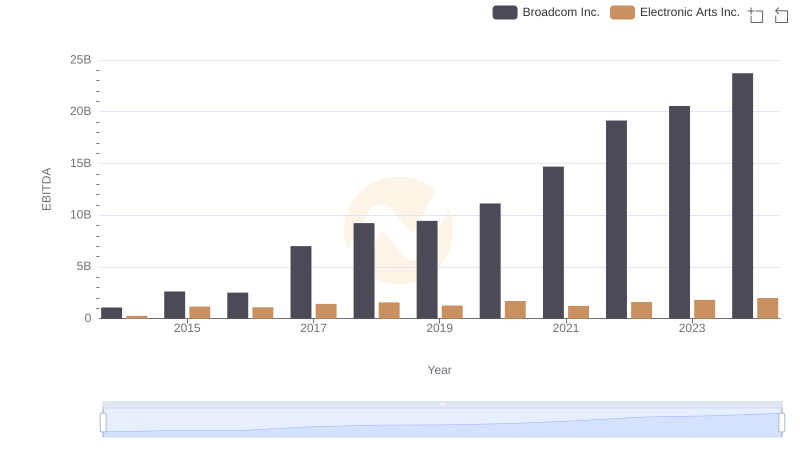
Comprehensive EBITDA Comparison: Broadcom Inc. vs Electronic Arts Inc.
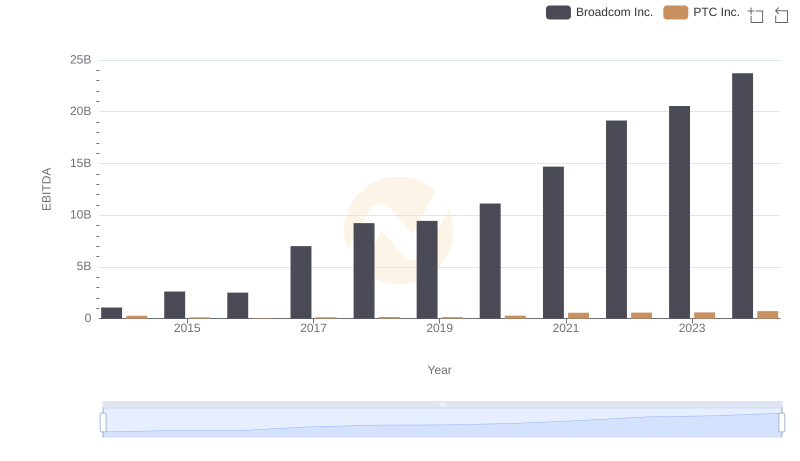
EBITDA Analysis: Evaluating Broadcom Inc. Against PTC Inc.
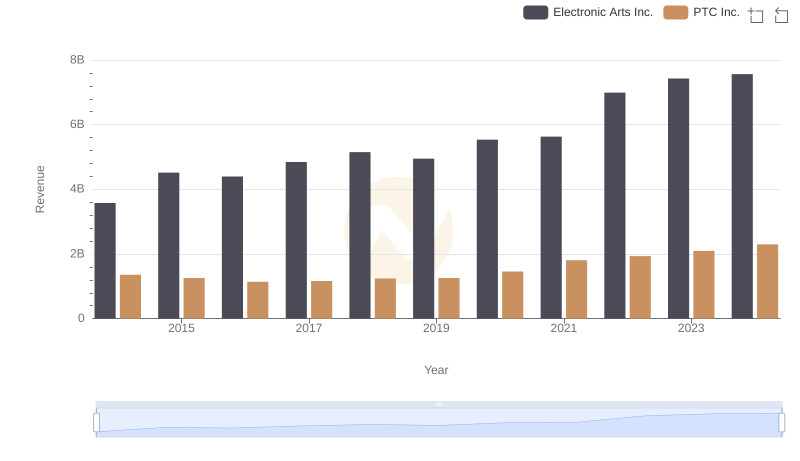
Electronic Arts Inc. and PTC Inc.: A Comprehensive Revenue Analysis
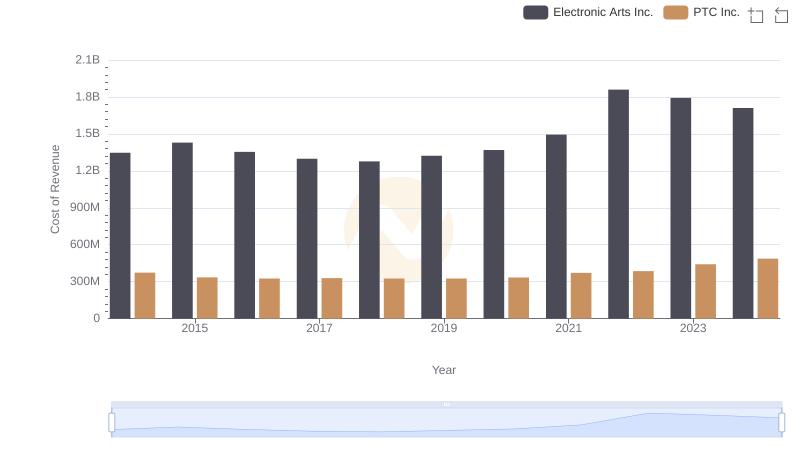
Cost Insights: Breaking Down Electronic Arts Inc. and PTC Inc.'s Expenses
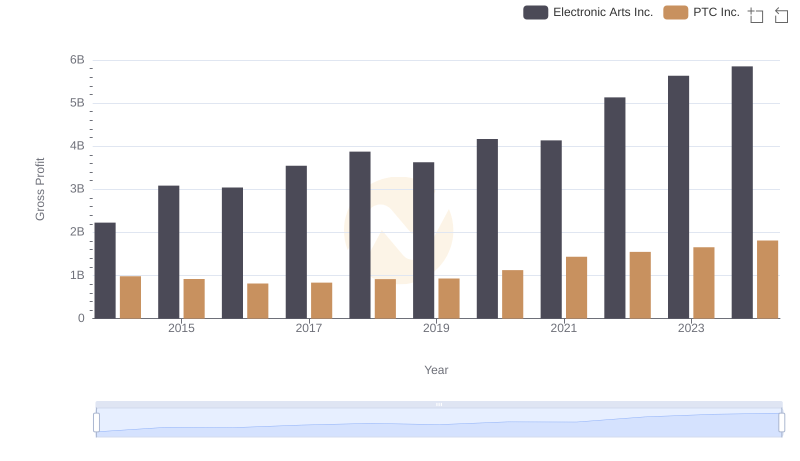
Electronic Arts Inc. vs PTC Inc.: A Gross Profit Performance Breakdown
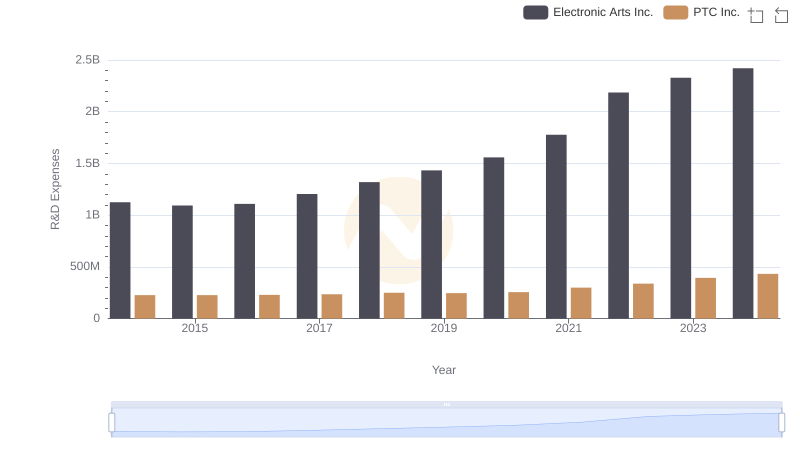
Comparing Innovation Spending: Electronic Arts Inc. and PTC Inc.
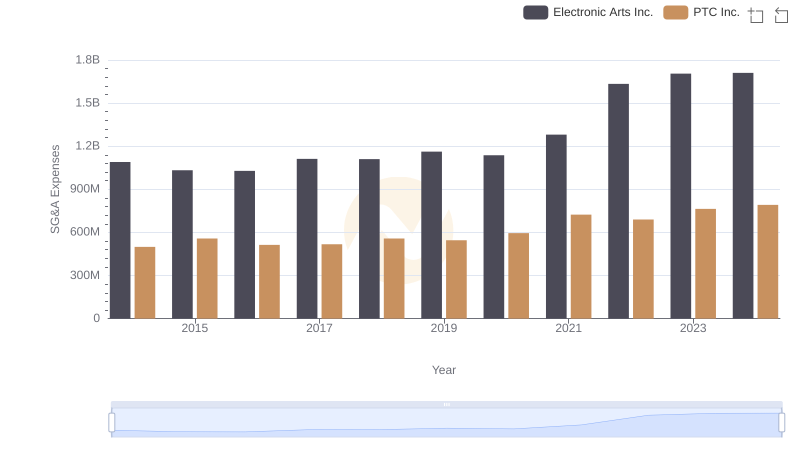
Who Optimizes SG&A Costs Better? Electronic Arts Inc. or PTC Inc.