| __timestamp | Electronic Arts Inc. | PTC Inc. |
|---|---|---|
| Wednesday, January 1, 2014 | 1125000000 | 226496000 |
| Thursday, January 1, 2015 | 1094000000 | 227513000 |
| Friday, January 1, 2016 | 1109000000 | 229331000 |
| Sunday, January 1, 2017 | 1205000000 | 236059000 |
| Monday, January 1, 2018 | 1320000000 | 249774000 |
| Tuesday, January 1, 2019 | 1433000000 | 246888000 |
| Wednesday, January 1, 2020 | 1559000000 | 256575000 |
| Friday, January 1, 2021 | 1778000000 | 299917000 |
| Saturday, January 1, 2022 | 2186000000 | 338822000 |
| Sunday, January 1, 2023 | 2328000000 | 394370000 |
| Monday, January 1, 2024 | 2420000000 | 433047000 |
Unlocking the unknown
In the fast-paced world of technology and gaming, innovation is the lifeblood of success. Companies that prioritize research and development (R&D) are often the ones that lead their industries, creating groundbreaking products that capture market share and consumer attention. This article delves into the R&D spending trends of two prominent players in their respective fields: Electronic Arts Inc. (EA) and PTC Inc.
Electronic Arts, founded in 1982, has evolved into a titan of the gaming industry, known for its popular franchises such as FIFA and The Sims. On the other hand, PTC, established in 1985, specializes in software solutions for product development and lifecycle management. Both companies have recognized the importance of R&D as a key driver of growth and competitive advantage.
From 2014 to 2023, Electronic Arts has consistently increased its investment in R&D, showcasing a remarkable growth trajectory. In 2014, EA spent approximately $1.125 billion on innovation, which represented a significant portion of its revenue. By 2023, this figure surged to around $2.328 billion, reflecting an impressive increase of nearly 107% over the decade. This upward trend underscores EA's commitment to enhancing gaming experiences and developing new technologies.
In stark contrast, PTC's R&D spending has also shown growth, albeit at a more modest pace. Starting at approximately $226 million in 2014, PTC's investment rose to about $394 million by 2023, marking an increase of around 74%. While this growth is commendable, it pales in comparison to EA's aggressive R&D strategy.
Analyzing the yearly data reveals interesting insights. For instance, in 2018, Electronic Arts' R&D expenses reached approximately $1.32 billion, while PTC's spending was around $249 million. This stark difference illustrates EA's larger scale of investment, which is essential for maintaining its competitive edge in the gaming sector. Furthermore, in 2022, EA's R&D expenses peaked at about $2.186 billion, showcasing a staggering increase of 65% from 2019, while PTC's investment during the same period was only $338 million.
The data clearly indicates that Electronic Arts is not only investing significantly more in R&D compared to PTC, but it is also doing so at a faster rate. This strategic focus on innovation positions EA to continue leading in the gaming industry, while PTC must consider ramping up its investment to keep pace in the competitive software landscape. As technology continues to evolve, the companies that prioritize R&D will likely emerge as the frontrunners in their respective fields. The insights drawn from this comparative analysis highlight the critical role that R&D spending plays in shaping the future of these iconic companies.
By understanding these trends, stakeholders can better appreciate the strategic decisions that drive growth and innovation in the tech and gaming industries.
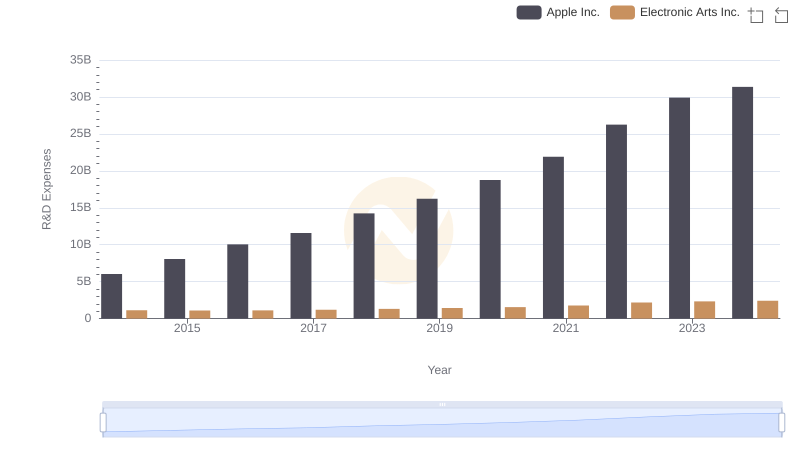
Research and Development: Comparing Key Metrics for Apple Inc. and Electronic Arts Inc.
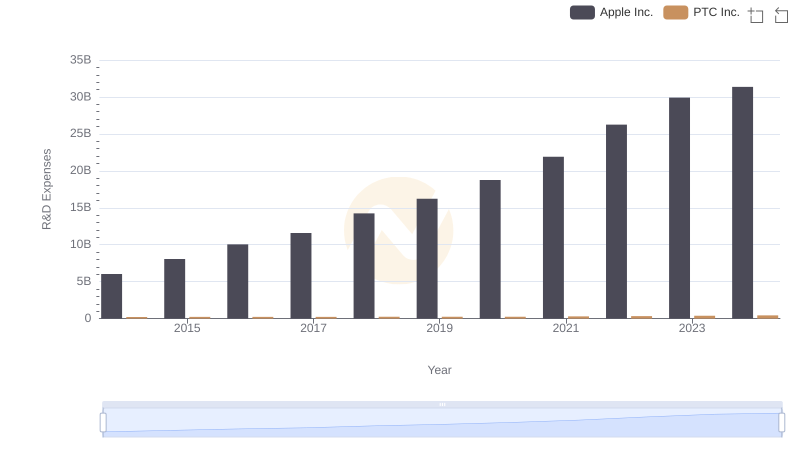
Apple Inc. or PTC Inc.: Who Invests More in Innovation?
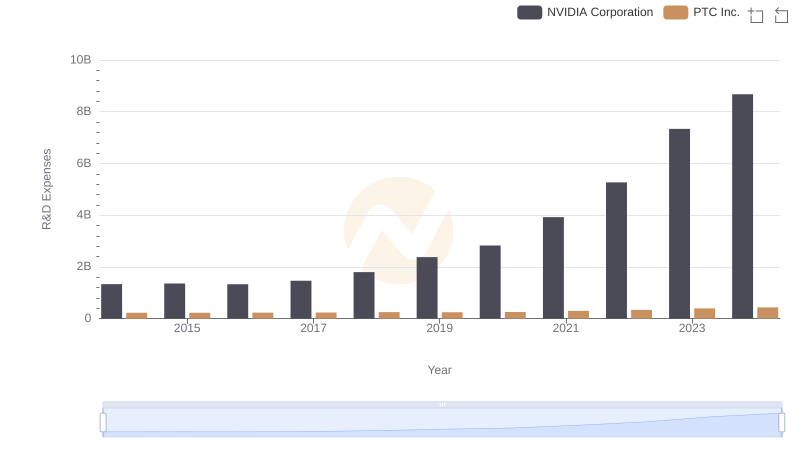
R&D Spending Showdown: NVIDIA Corporation vs PTC Inc.
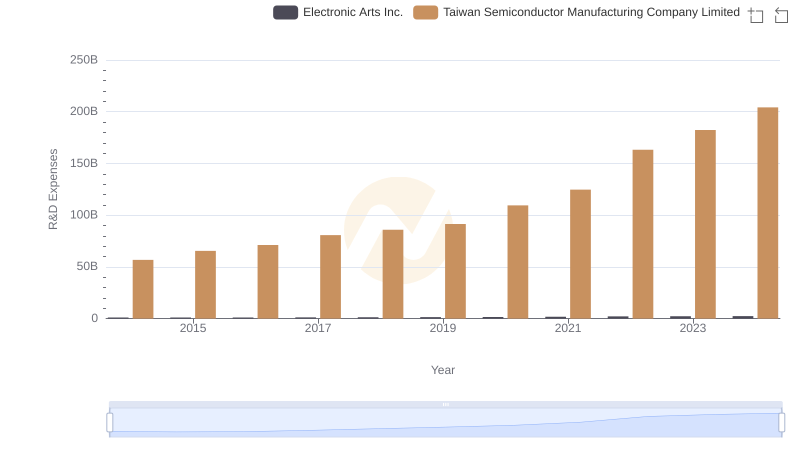
Taiwan Semiconductor Manufacturing Company Limited vs Electronic Arts Inc.: Strategic Focus on R&D Spending
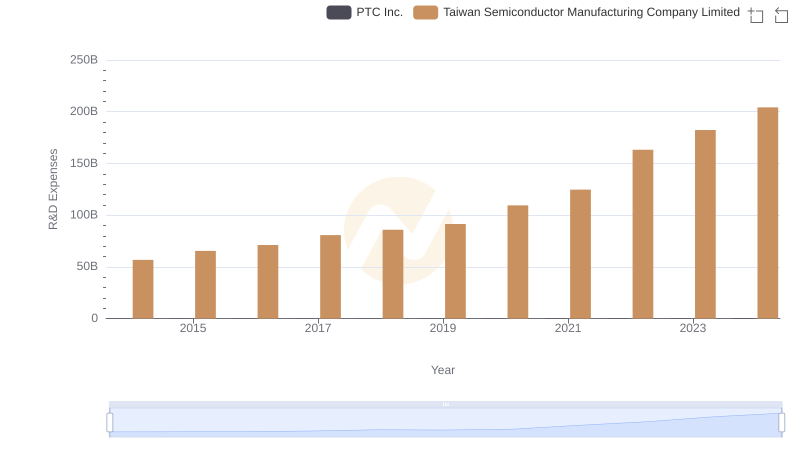
Taiwan Semiconductor Manufacturing Company Limited vs PTC Inc.: Strategic Focus on R&D Spending
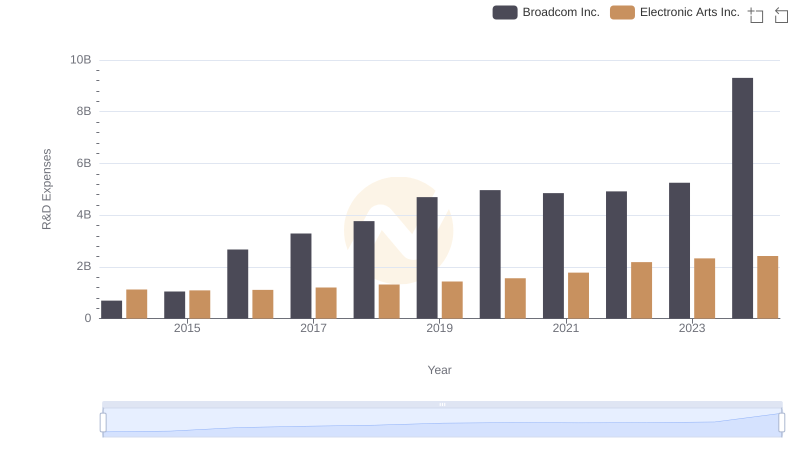
Research and Development: Comparing Key Metrics for Broadcom Inc. and Electronic Arts Inc.
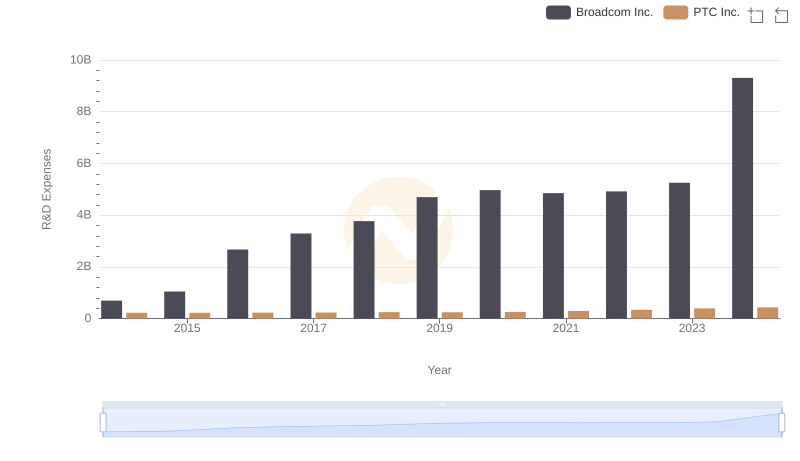
Research and Development: Comparing Key Metrics for Broadcom Inc. and PTC Inc.
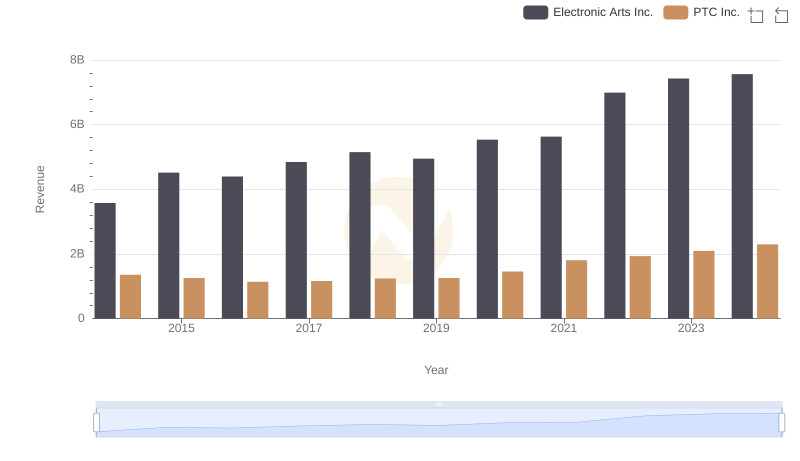
Electronic Arts Inc. and PTC Inc.: A Comprehensive Revenue Analysis
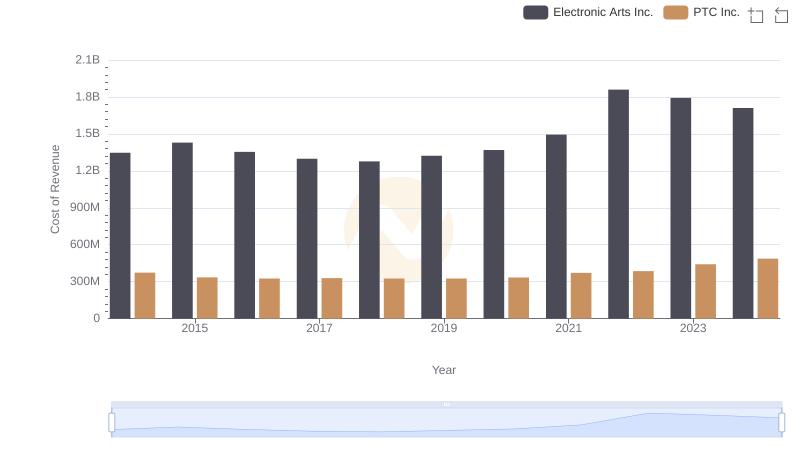
Cost Insights: Breaking Down Electronic Arts Inc. and PTC Inc.'s Expenses
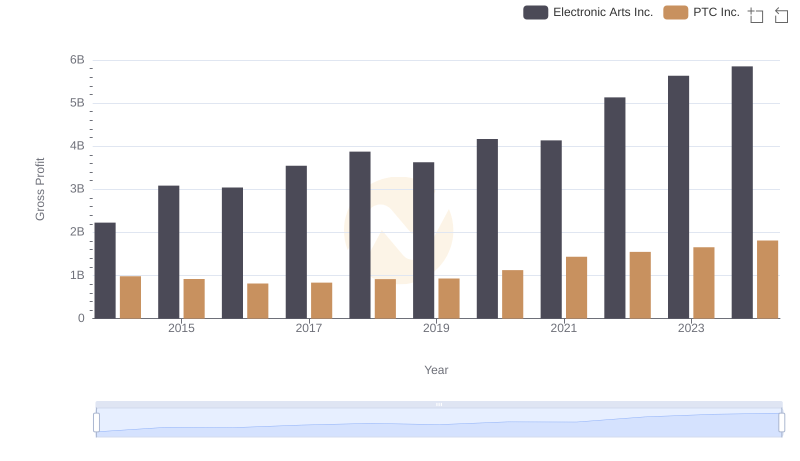
Electronic Arts Inc. vs PTC Inc.: A Gross Profit Performance Breakdown
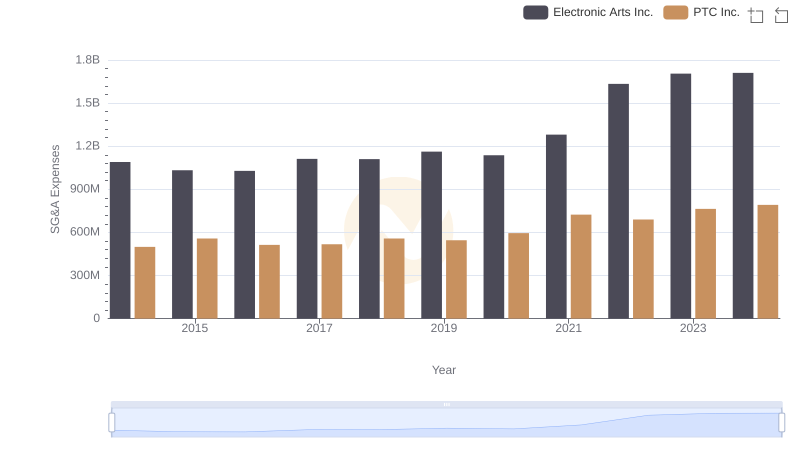
Who Optimizes SG&A Costs Better? Electronic Arts Inc. or PTC Inc.
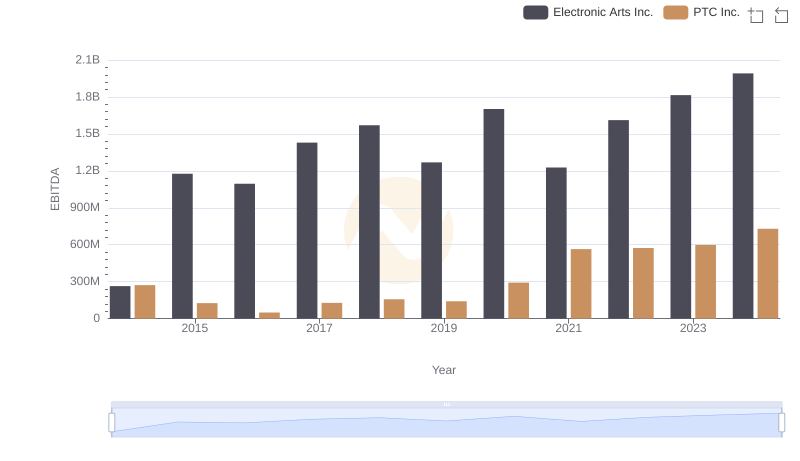
Comparative EBITDA Analysis: Electronic Arts Inc. vs PTC Inc.