| __timestamp | Micron Technology, Inc. | Wipro Limited |
|---|---|---|
| Wednesday, January 1, 2014 | 5188000000 | 128105000000 |
| Thursday, January 1, 2015 | 5647000000 | 107958000000 |
| Friday, January 1, 2016 | 3136000000 | 133082000000 |
| Sunday, January 1, 2017 | 9658000000 | 126406000000 |
| Monday, January 1, 2018 | 19408000000 | 114648000000 |
| Tuesday, January 1, 2019 | 12600000000 | 122279000000 |
| Wednesday, January 1, 2020 | 8827000000 | 168413000000 |
| Friday, January 1, 2021 | 12615000000 | 165303000000 |
| Saturday, January 1, 2022 | 16876000000 | 189377000000 |
| Sunday, January 1, 2023 | 2486000000 | 193833000000 |
| Monday, January 1, 2024 | 9582000000 | 193833000000 |
Unleashing the power of data
In the ever-evolving landscape of global technology, Micron Technology, Inc. and Wipro Limited stand as titans, each with a unique trajectory in EBITDA performance. Over the past decade, Micron's EBITDA has seen a rollercoaster ride, peaking in 2018 with a remarkable 100% increase from 2016, only to dip significantly by 2023. In contrast, Wipro has maintained a steady upward trend, with its EBITDA growing by approximately 51% from 2014 to 2023.
Micron's performance reflects the volatile nature of the semiconductor industry, where market demand and supply chain dynamics play crucial roles. Meanwhile, Wipro's consistent growth underscores its robust position in the IT services sector, capitalizing on digital transformation trends. As we look to the future, these trends offer a fascinating glimpse into the strategic maneuvers of these industry leaders.
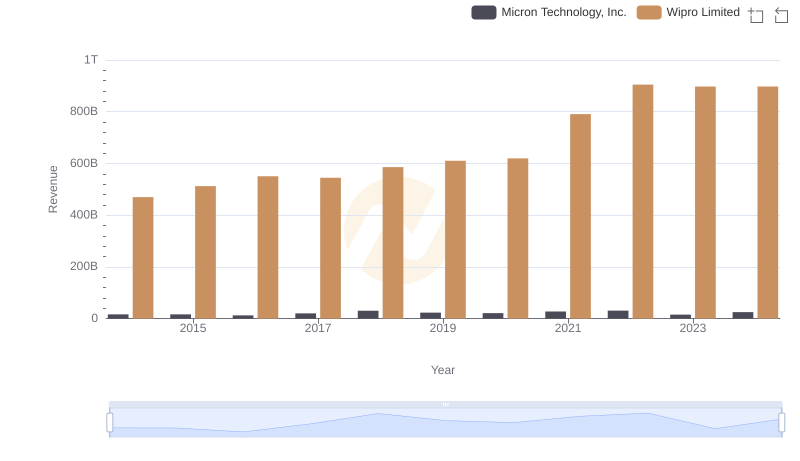
Micron Technology, Inc. vs Wipro Limited: Examining Key Revenue Metrics
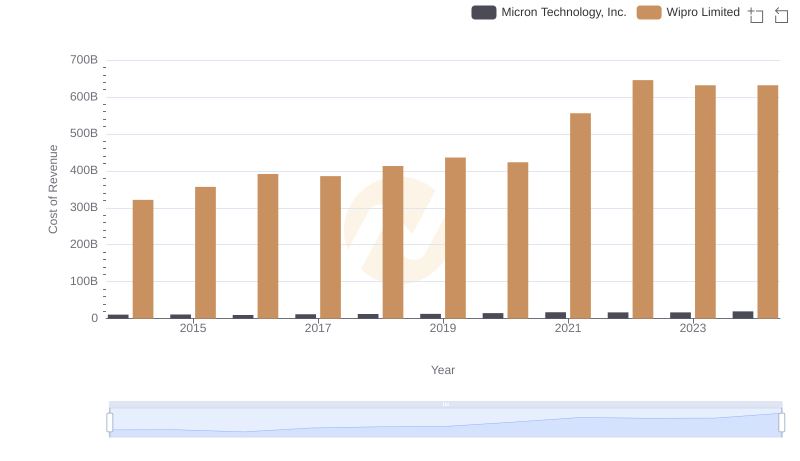
Micron Technology, Inc. vs Wipro Limited: Efficiency in Cost of Revenue Explored
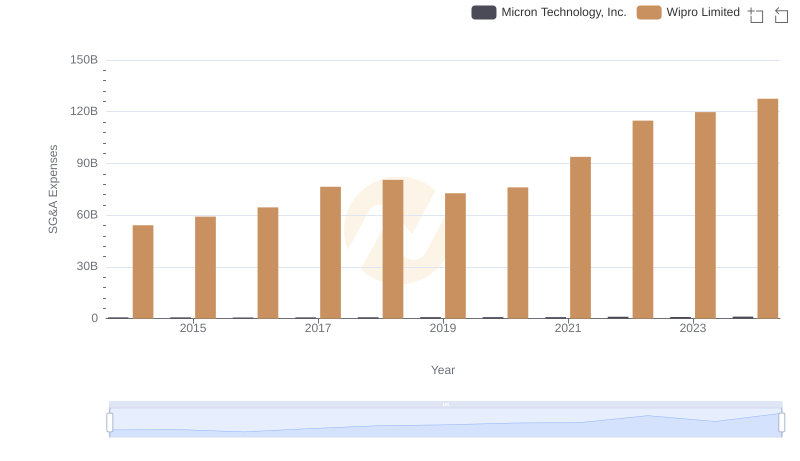
Selling, General, and Administrative Costs: Micron Technology, Inc. vs Wipro Limited
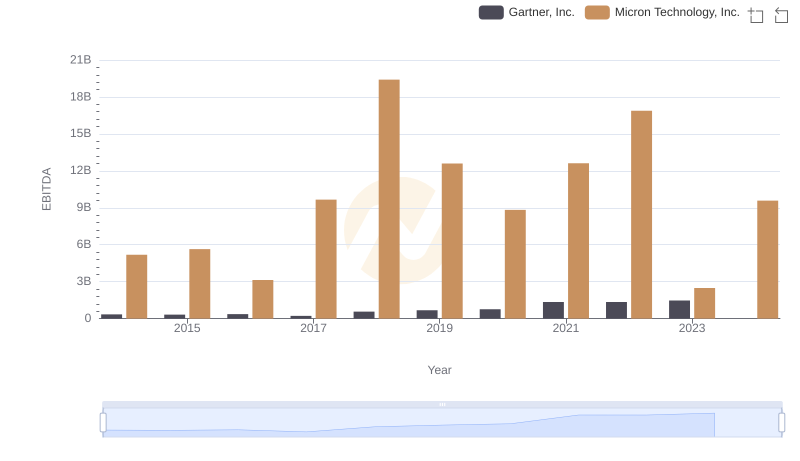
Micron Technology, Inc. vs Gartner, Inc.: In-Depth EBITDA Performance Comparison
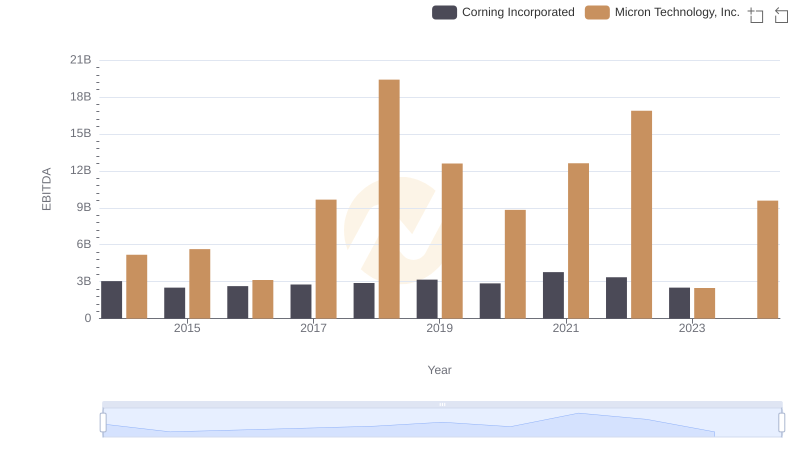
A Professional Review of EBITDA: Micron Technology, Inc. Compared to Corning Incorporated
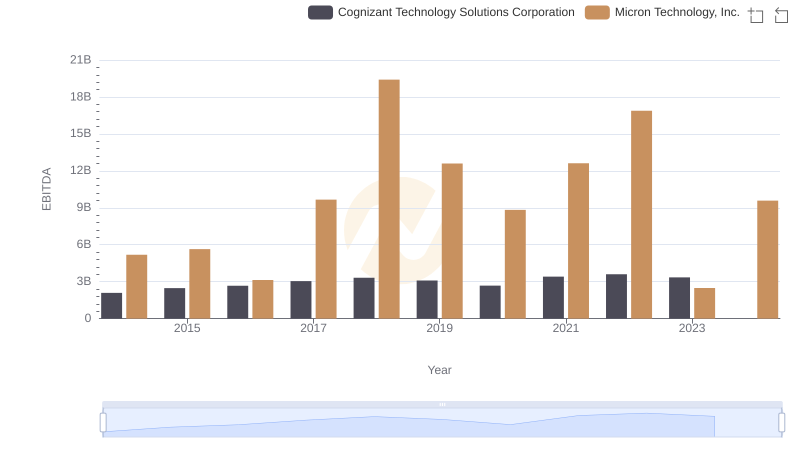
Professional EBITDA Benchmarking: Micron Technology, Inc. vs Cognizant Technology Solutions Corporation
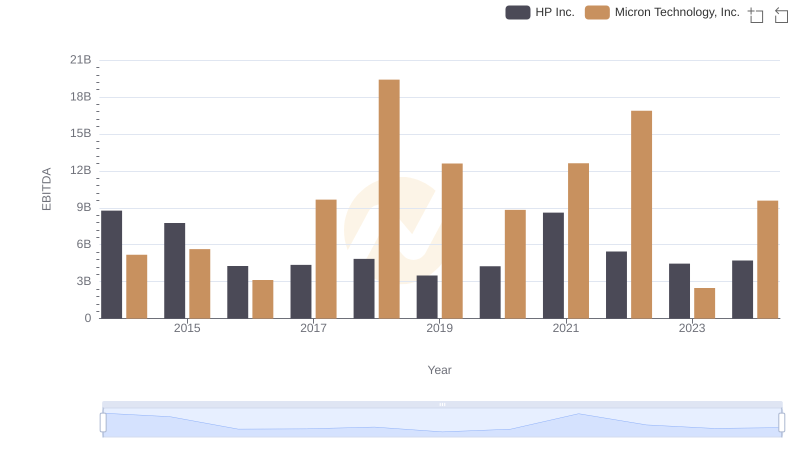
A Professional Review of EBITDA: Micron Technology, Inc. Compared to HP Inc.
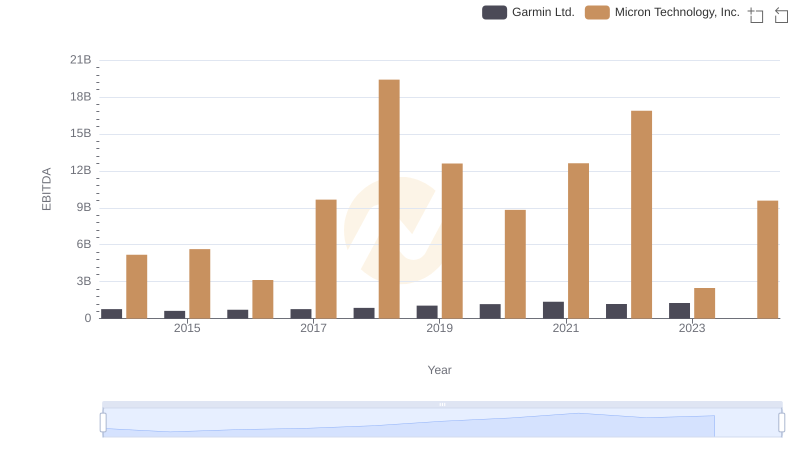
Comparative EBITDA Analysis: Micron Technology, Inc. vs Garmin Ltd.
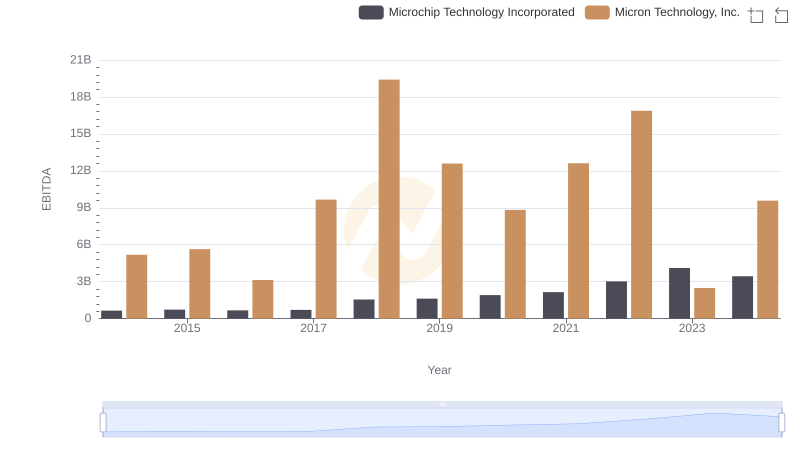
Micron Technology, Inc. vs Microchip Technology Incorporated: In-Depth EBITDA Performance Comparison
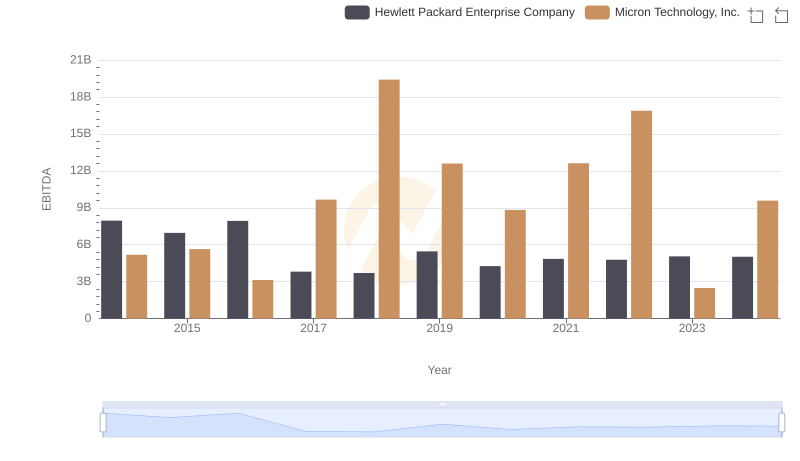
EBITDA Analysis: Evaluating Micron Technology, Inc. Against Hewlett Packard Enterprise Company
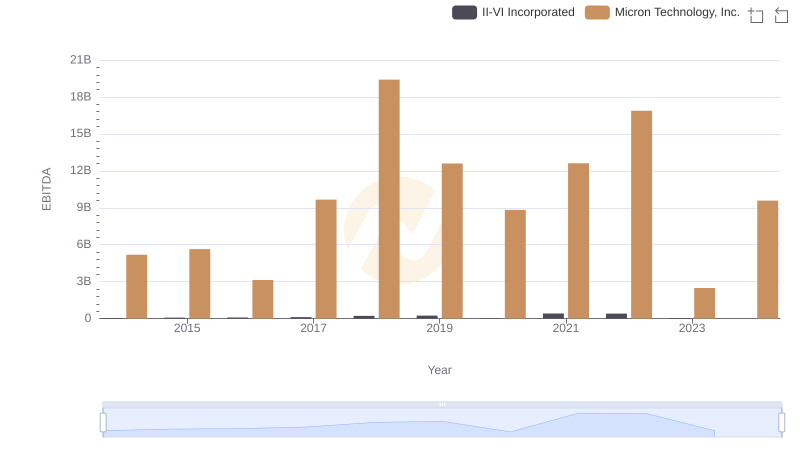
A Side-by-Side Analysis of EBITDA: Micron Technology, Inc. and II-VI Incorporated
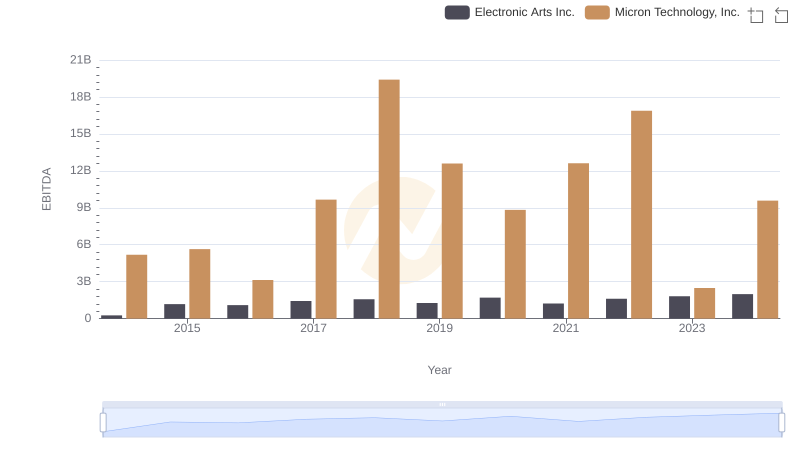
A Professional Review of EBITDA: Micron Technology, Inc. Compared to Electronic Arts Inc.