| __timestamp | Garmin Ltd. | Micron Technology, Inc. |
|---|---|---|
| Wednesday, January 1, 2014 | 767641000 | 5188000000 |
| Thursday, January 1, 2015 | 627941000 | 5647000000 |
| Friday, January 1, 2016 | 719204000 | 3136000000 |
| Sunday, January 1, 2017 | 769889000 | 9658000000 |
| Monday, January 1, 2018 | 874537000 | 19408000000 |
| Tuesday, January 1, 2019 | 1051761000 | 12600000000 |
| Wednesday, January 1, 2020 | 1180955000 | 8827000000 |
| Friday, January 1, 2021 | 1373438000 | 12615000000 |
| Saturday, January 1, 2022 | 1191698000 | 16876000000 |
| Sunday, January 1, 2023 | 1269732000 | 2486000000 |
| Monday, January 1, 2024 | 1593994000 | 9582000000 |
Unleashing the power of data
In the ever-evolving landscape of technology and consumer electronics, Micron Technology, Inc. and Garmin Ltd. have carved distinct paths. From 2014 to 2023, Micron's EBITDA has shown remarkable volatility, peaking in 2018 with a staggering 1,940% increase from its 2014 figures. In contrast, Garmin's EBITDA has demonstrated steady growth, with a 65% increase over the same period, reflecting its resilience and consistent market strategy.
Micron's performance, however, took a downturn in 2023, dropping to levels seen in 2016, highlighting the cyclical nature of the semiconductor industry. Meanwhile, Garmin's EBITDA in 2023 remained robust, underscoring its stable position in the market. This comparative analysis not only highlights the dynamic nature of these industries but also offers insights into the strategic maneuvers of these two giants over the past decade.
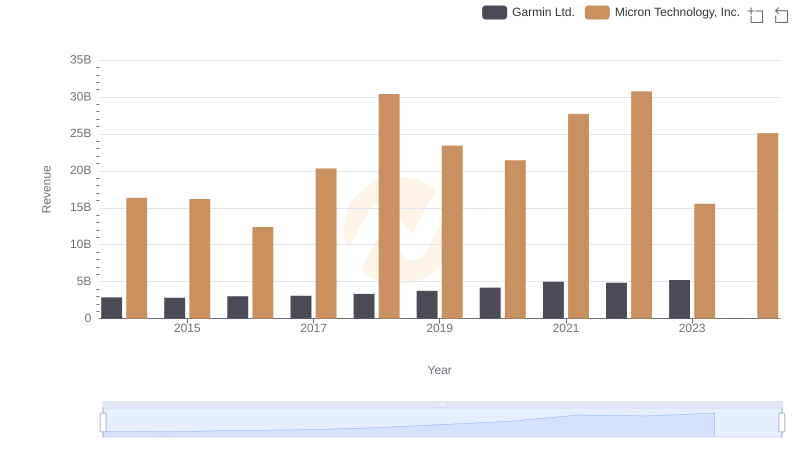
Who Generates More Revenue? Micron Technology, Inc. or Garmin Ltd.
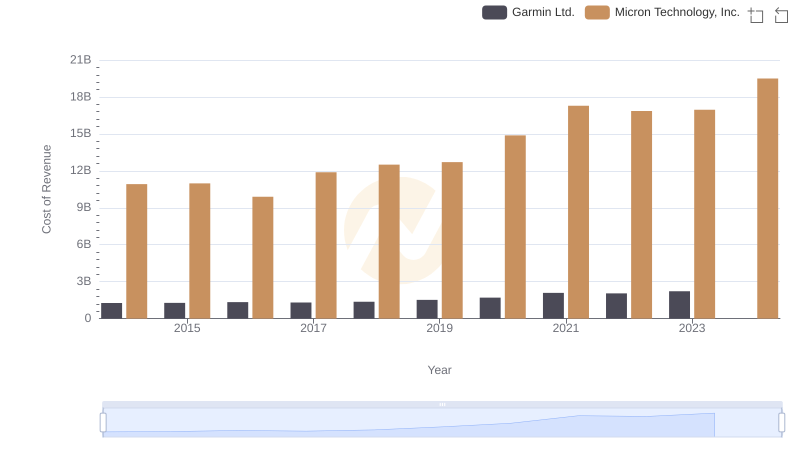
Analyzing Cost of Revenue: Micron Technology, Inc. and Garmin Ltd.
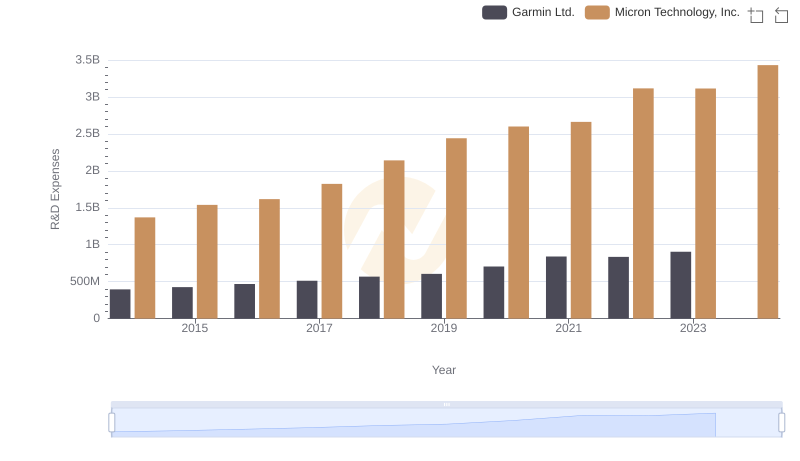
R&D Insights: How Micron Technology, Inc. and Garmin Ltd. Allocate Funds
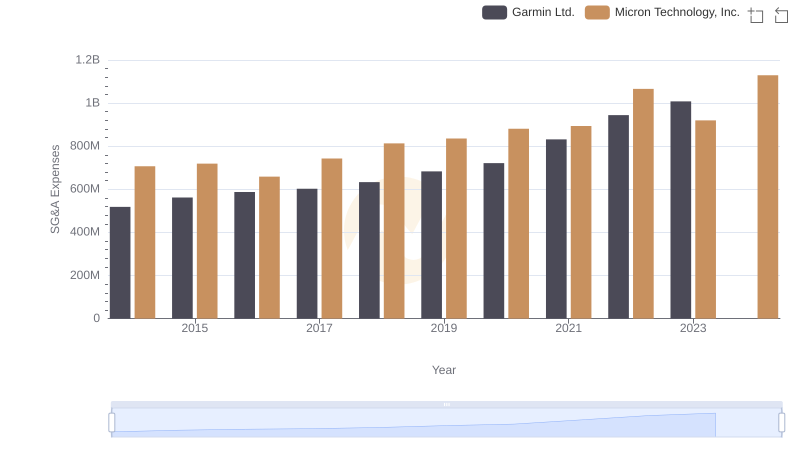
Who Optimizes SG&A Costs Better? Micron Technology, Inc. or Garmin Ltd.
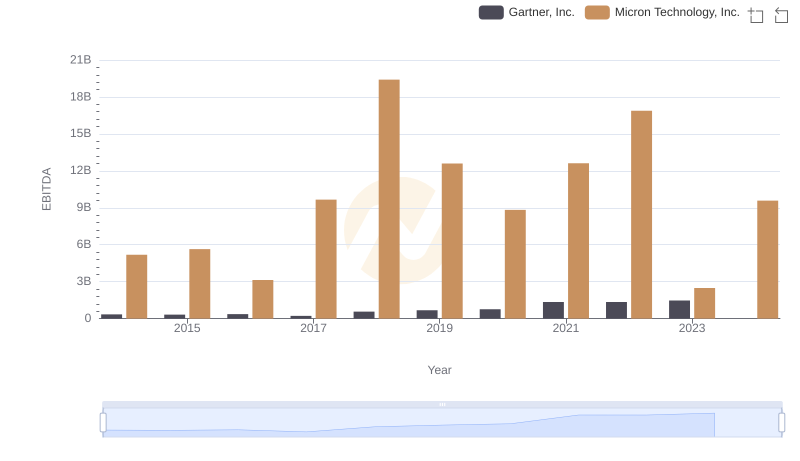
Micron Technology, Inc. vs Gartner, Inc.: In-Depth EBITDA Performance Comparison
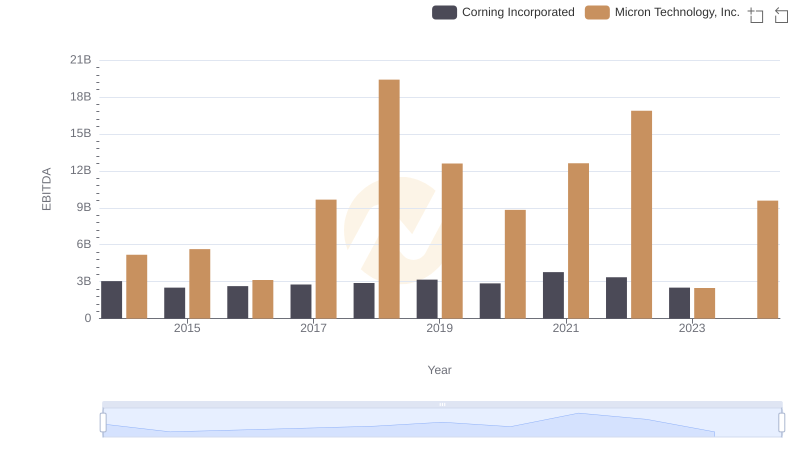
A Professional Review of EBITDA: Micron Technology, Inc. Compared to Corning Incorporated
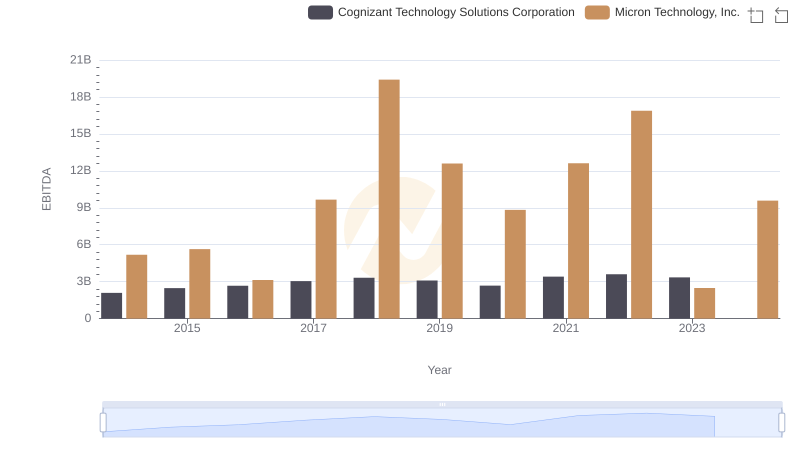
Professional EBITDA Benchmarking: Micron Technology, Inc. vs Cognizant Technology Solutions Corporation
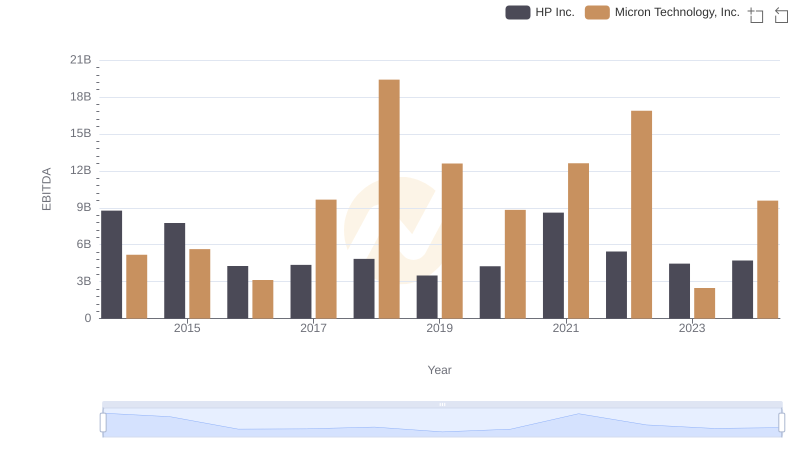
A Professional Review of EBITDA: Micron Technology, Inc. Compared to HP Inc.
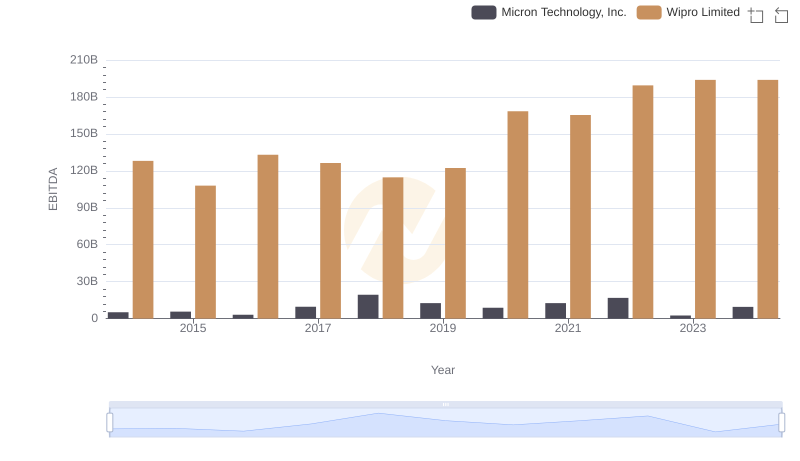
EBITDA Performance Review: Micron Technology, Inc. vs Wipro Limited
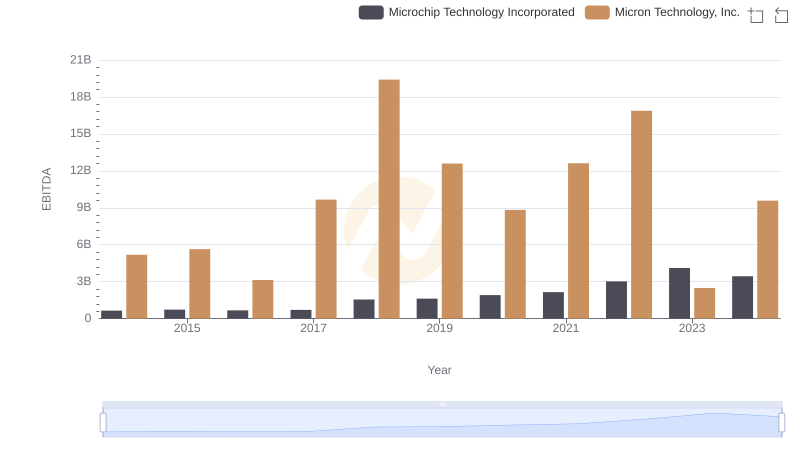
Micron Technology, Inc. vs Microchip Technology Incorporated: In-Depth EBITDA Performance Comparison
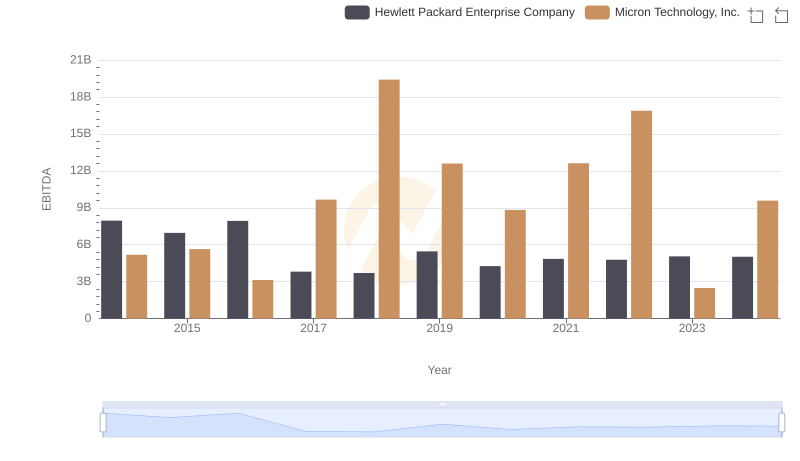
EBITDA Analysis: Evaluating Micron Technology, Inc. Against Hewlett Packard Enterprise Company
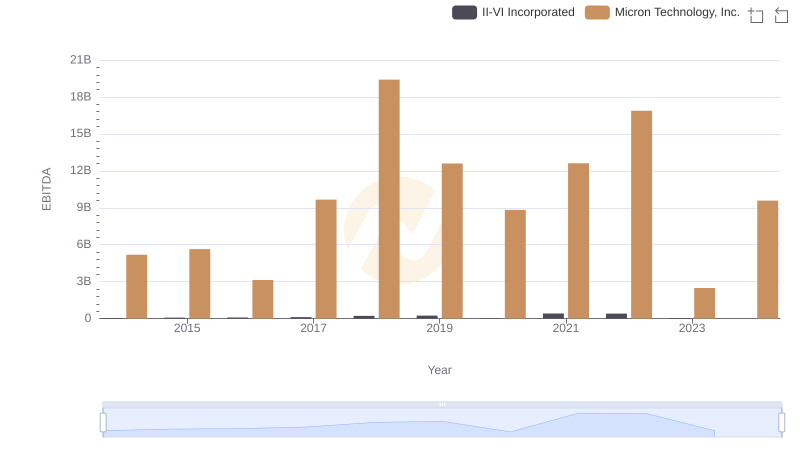
A Side-by-Side Analysis of EBITDA: Micron Technology, Inc. and II-VI Incorporated