| __timestamp | Eaton Corporation plc | Saia, Inc. |
|---|---|---|
| Wednesday, January 1, 2014 | 3586000000 | 144715000 |
| Thursday, January 1, 2015 | 3302000000 | 154995000 |
| Friday, January 1, 2016 | 3176000000 | 156092000 |
| Sunday, January 1, 2017 | 3418000000 | 181629000 |
| Monday, January 1, 2018 | 3875000000 | 243709000 |
| Tuesday, January 1, 2019 | 2827000000 | 271318000 |
| Wednesday, January 1, 2020 | 1674000000 | 312448000 |
| Friday, January 1, 2021 | 2423000000 | 472947000 |
| Saturday, January 1, 2022 | 3031000000 | 627741000 |
| Sunday, January 1, 2023 | 4904000000 | 647607000 |
| Monday, January 1, 2024 | 5547999771 |
Unleashing insights
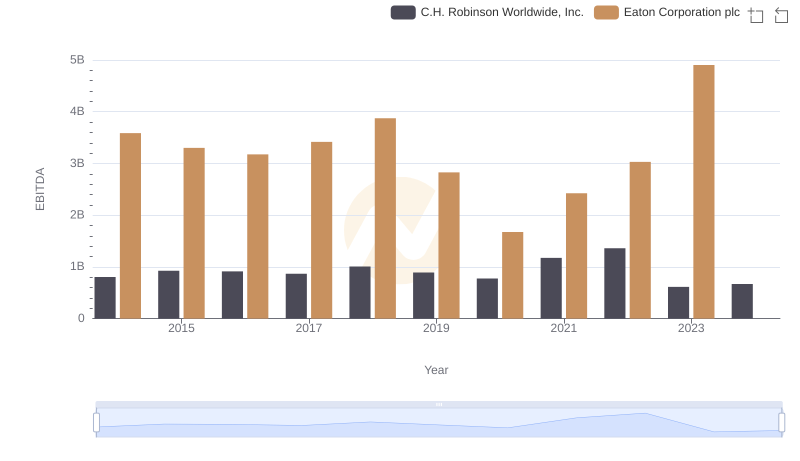
In the ever-evolving landscape of industrial and logistics sectors, Eaton Corporation plc and Saia, Inc. have showcased intriguing financial trajectories over the past decade. From 2014 to 2023, Eaton's EBITDA has seen a robust growth of approximately 37%, peaking in 2023 with a remarkable 4.9 billion. This reflects Eaton's strategic adaptability and resilience, especially during challenging economic periods like 2020.
Conversely, Saia, Inc. has demonstrated a dynamic upward trend, with its EBITDA surging by over 347% from 2014 to 2023. This impressive growth underscores Saia's expanding footprint in the logistics industry, capitalizing on the e-commerce boom and supply chain innovations.
As we delve into these financial narratives, it's evident that both companies have navigated their respective markets with distinct strategies, offering valuable insights into their operational efficiencies and market positioning.