| __timestamp | Eaton Corporation plc | Republic Services, Inc. |
|---|---|---|
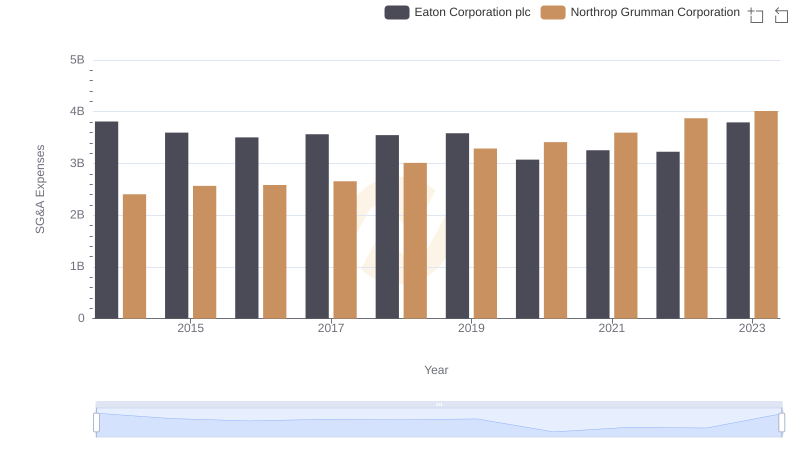
| Wednesday, January 1, 2014 | 3810000000 | 896300000 |
| Thursday, January 1, 2015 | 3596000000 | 960400000 |
| Friday, January 1, 2016 | 3505000000 | 949400000 |
| Sunday, January 1, 2017 | 3565000000 | 1026800000 |
| Monday, January 1, 2018 | 3548000000 | 1059500000 |
| Tuesday, January 1, 2019 | 3583000000 | 1042000000 |
| Wednesday, January 1, 2020 | 3075000000 | 1025200000 |
| Friday, January 1, 2021 | 3256000000 | 1175900000 |
| Saturday, January 1, 2022 | 3227000000 | 1335800000 |
| Sunday, January 1, 2023 | 3795000000 | 1522000000 |
| Monday, January 1, 2024 | 4077000000 | 1647000000 |
Unleashing the power of data
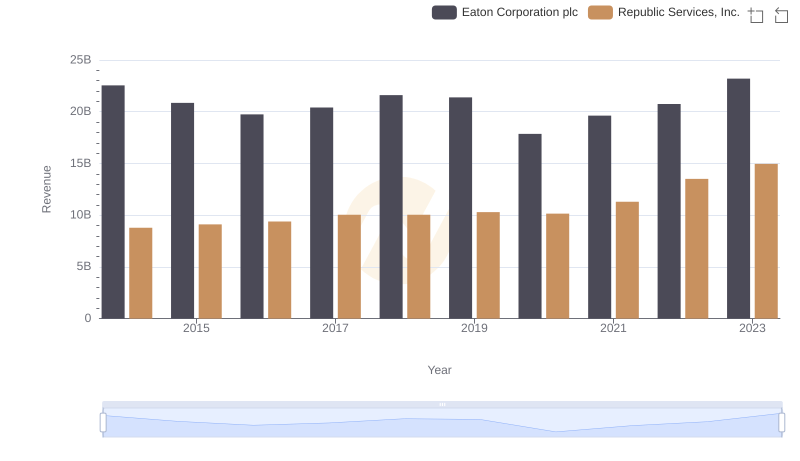
In the ever-evolving landscape of corporate finance, understanding the nuances of Selling, General, and Administrative (SG&A) expenses is crucial. Eaton Corporation plc and Republic Services, Inc. offer a fascinating case study in contrasting SG&A spending patterns over the past decade.
From 2014 to 2023, Eaton's SG&A expenses have shown a relatively stable trend, with a slight dip in 2020, likely due to global economic disruptions. However, by 2023, Eaton's SG&A expenses rebounded to nearly 3.8 billion, reflecting a strategic focus on maintaining operational efficiency.
In contrast, Republic Services has seen a significant increase in SG&A expenses, growing by approximately 70% from 2014 to 2023. This rise indicates a robust expansion strategy, aligning with the company's growth in market share and service offerings.
These insights underscore the diverse strategies companies employ in managing operational costs, offering valuable lessons for investors and industry analysts alike.