| __timestamp | Eaton Corporation plc | Republic Services, Inc. |
|---|---|---|
| Wednesday, January 1, 2014 | 3586000000 | 2241300000 |
| Thursday, January 1, 2015 | 3302000000 | 2563300000 |
| Friday, January 1, 2016 | 3176000000 | 2653900000 |
| Sunday, January 1, 2017 | 3418000000 | 2769500000 |
| Monday, January 1, 2018 | 3875000000 | 2831400000 |
| Tuesday, January 1, 2019 | 2827000000 | 2909100000 |
| Wednesday, January 1, 2020 | 1674000000 | 3000100000 |
| Friday, January 1, 2021 | 2423000000 | 3384800000 |
| Saturday, January 1, 2022 | 3031000000 | 3659500000 |
| Sunday, January 1, 2023 | 4904000000 | 4320500000 |
| Monday, January 1, 2024 | 5547999771 | 4755000000 |
Cracking the code
In the ever-evolving landscape of industrial and waste management sectors, Eaton Corporation plc and Republic Services, Inc. have showcased intriguing financial trajectories over the past decade. From 2014 to 2023, Eaton's EBITDA fluctuated, peaking in 2023 with a remarkable 54% increase from its 2020 low. Meanwhile, Republic Services demonstrated a steady climb, achieving a 93% growth in EBITDA over the same period.
This comparative analysis not only highlights the financial health of these giants but also offers a lens into their strategic maneuvers in response to market dynamics. Investors and industry watchers can glean valuable insights into the resilience and adaptability of these companies.
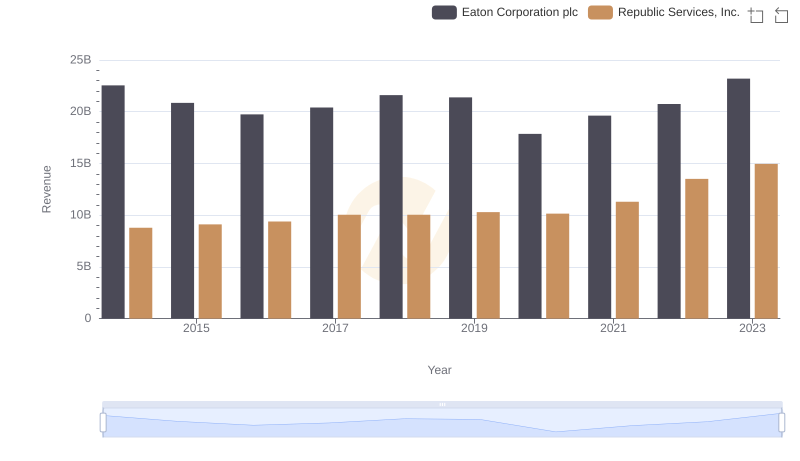
Breaking Down Revenue Trends: Eaton Corporation plc vs Republic Services, Inc.
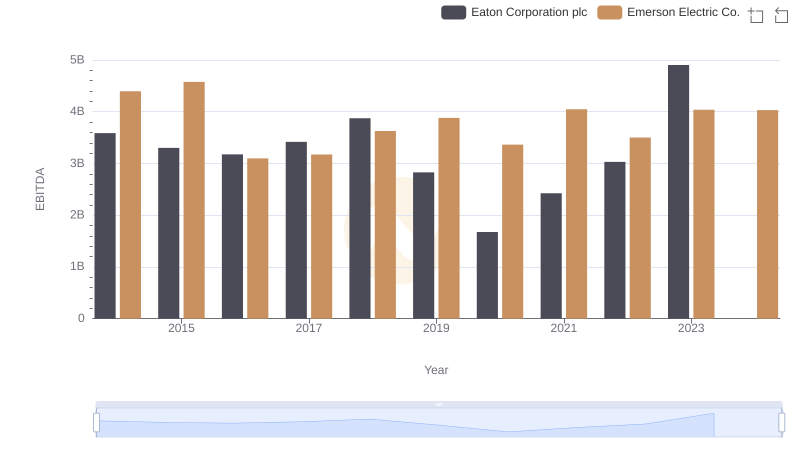
EBITDA Performance Review: Eaton Corporation plc vs Emerson Electric Co.
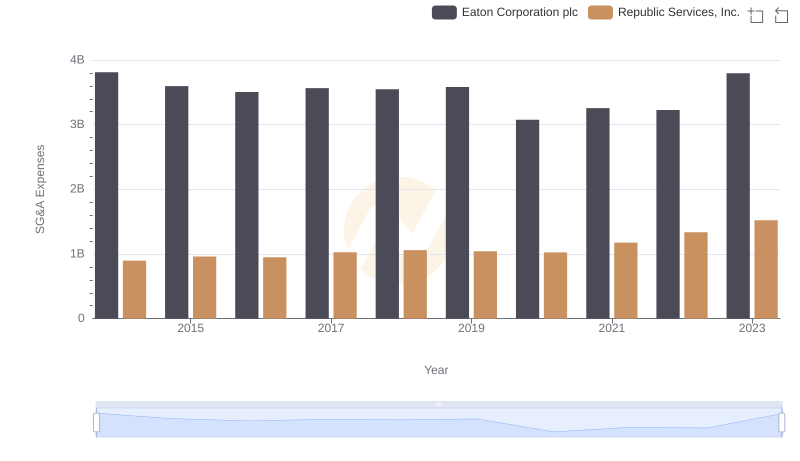
Eaton Corporation plc and Republic Services, Inc.: SG&A Spending Patterns Compared
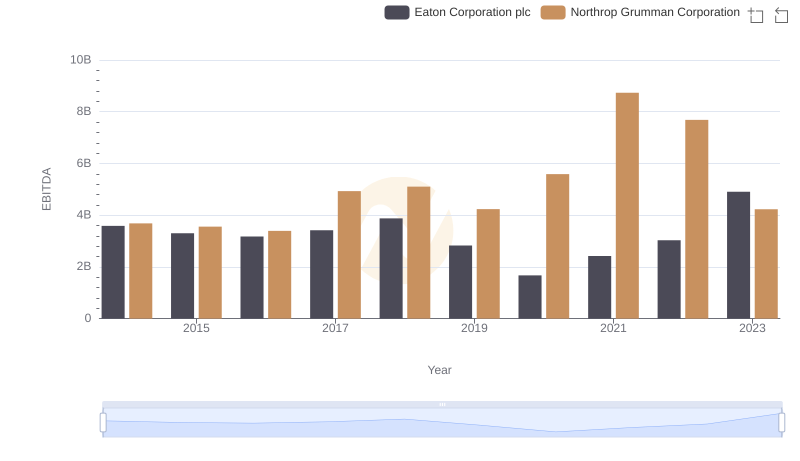
Comprehensive EBITDA Comparison: Eaton Corporation plc vs Northrop Grumman Corporation