| __timestamp | Equifax Inc. | Union Pacific Corporation |
|---|---|---|
| Wednesday, January 1, 2014 | 844700000 | 14311000000 |
| Thursday, January 1, 2015 | 887400000 | 12837000000 |
| Friday, January 1, 2016 | 1113400000 | 11672000000 |
| Sunday, January 1, 2017 | 1210700000 | 12231000000 |
| Monday, January 1, 2018 | 1440400000 | 13293000000 |
| Tuesday, January 1, 2019 | 1521700000 | 12094000000 |
| Wednesday, January 1, 2020 | 1737400000 | 10354000000 |
| Friday, January 1, 2021 | 1980900000 | 11290000000 |
| Saturday, January 1, 2022 | 2177200000 | 13670000000 |
| Sunday, January 1, 2023 | 2335100000 | 13590000000 |
| Monday, January 1, 2024 | 0 | 13211000000 |
Unleashing insights
In the ever-evolving landscape of American business, understanding cost structures is crucial. This analysis delves into the cost of revenue trends for Union Pacific Corporation and Equifax Inc. from 2014 to 2023. Union Pacific, a titan in the transportation sector, consistently reported higher costs, peaking in 2014 with a 14% higher cost than in 2020. Meanwhile, Equifax, a leader in consumer credit reporting, saw a steady increase, with costs rising by approximately 176% over the same period. Notably, Equifax's cost of revenue in 2023 was 2.3 times higher than in 2014, reflecting its expanding operations. The data for 2024 is incomplete, highlighting the dynamic nature of financial reporting. These trends underscore the distinct operational challenges faced by these industry giants, offering insights into their strategic priorities and market conditions.
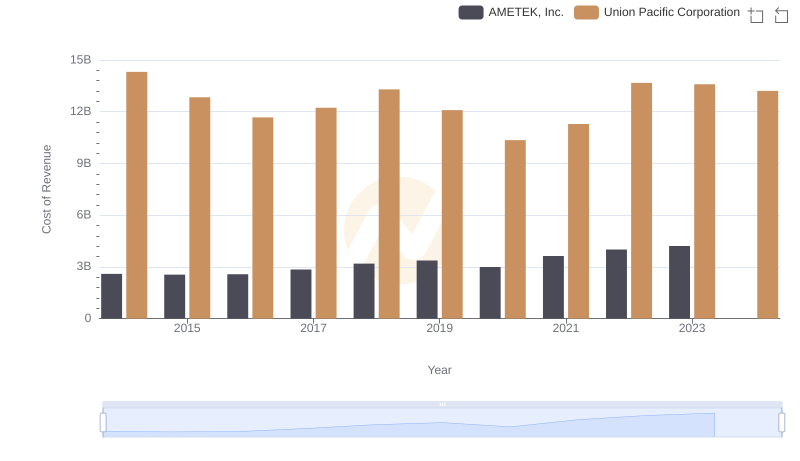
Analyzing Cost of Revenue: Union Pacific Corporation and AMETEK, Inc.

Cost of Revenue: Key Insights for Union Pacific Corporation and Westinghouse Air Brake Technologies Corporation
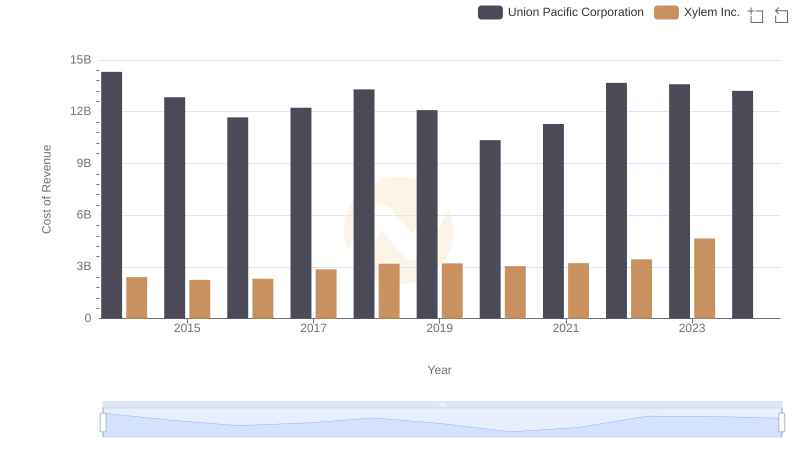
Cost of Revenue: Key Insights for Union Pacific Corporation and Xylem Inc.
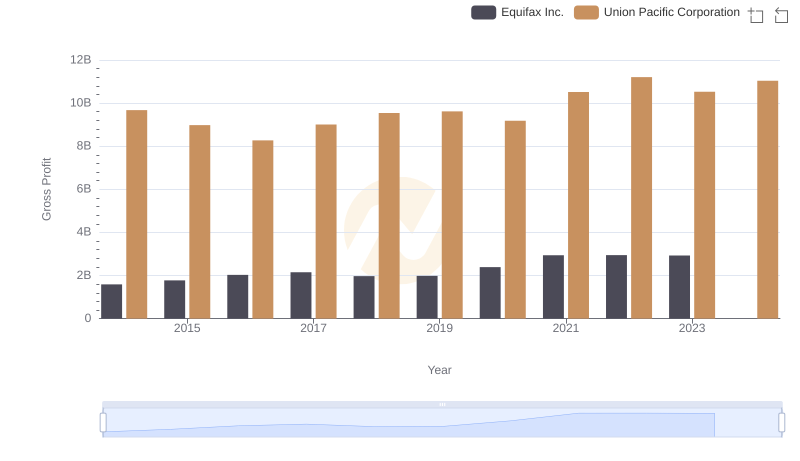
Union Pacific Corporation and Equifax Inc.: A Detailed Gross Profit Analysis