| __timestamp | Canadian National Railway Company | Hubbell Incorporated |
|---|---|---|
| Wednesday, January 1, 2014 | 7142000000 | 2250400000 |
| Thursday, January 1, 2015 | 6951000000 | 2298600000 |
| Friday, January 1, 2016 | 6362000000 | 2404500000 |
| Sunday, January 1, 2017 | 7366000000 | 2516900000 |
| Monday, January 1, 2018 | 8359000000 | 3181300000 |
| Tuesday, January 1, 2019 | 8832000000 | 3238300000 |
| Wednesday, January 1, 2020 | 8048000000 | 2976700000 |
| Friday, January 1, 2021 | 8408000000 | 3042600000 |
| Saturday, January 1, 2022 | 9711000000 | 3476300000 |
| Sunday, January 1, 2023 | 9677000000 | 3484800000 |
| Monday, January 1, 2024 | 3724400000 |
Igniting the spark of knowledge
The cost of revenue is a critical metric for understanding a company's financial health, especially in industries like transportation and manufacturing. This analysis focuses on the Canadian National Railway Company and Hubbell Incorporated, two giants in their respective fields. Over the past decade, Canadian National Railway has seen a steady increase in its cost of revenue, peaking in 2022 with a 53% rise from 2014. Meanwhile, Hubbell Incorporated experienced a 55% increase over the same period, reflecting its growth in the electrical products sector.
Understanding these trends can provide valuable insights for investors and industry analysts alike.
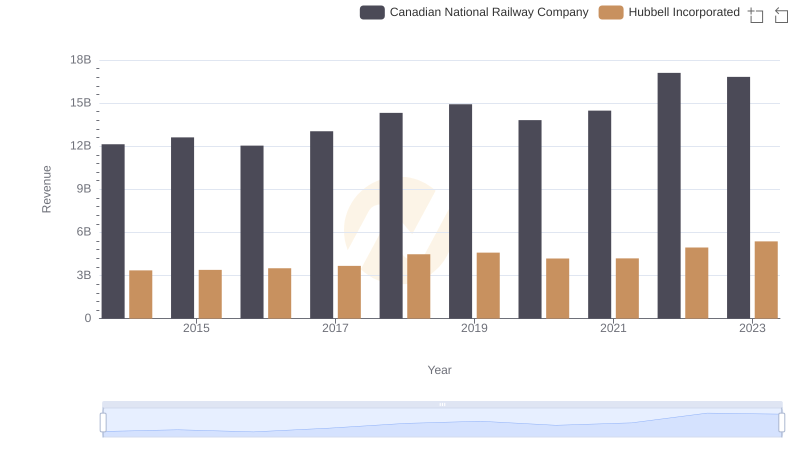
Canadian National Railway Company and Hubbell Incorporated: A Comprehensive Revenue Analysis

Cost of Revenue Trends: Canadian National Railway Company vs EMCOR Group, Inc.
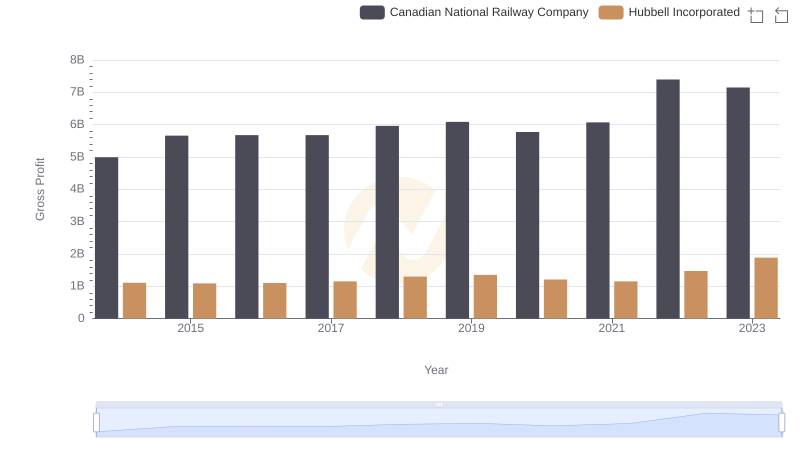
Who Generates Higher Gross Profit? Canadian National Railway Company or Hubbell Incorporated

EBITDA Metrics Evaluated: Canadian National Railway Company vs Hubbell Incorporated