| __timestamp | Allegion plc | Canadian National Railway Company |
|---|---|---|
| Wednesday, January 1, 2014 | 1264600000 | 7142000000 |
| Thursday, January 1, 2015 | 1199000000 | 6951000000 |
| Friday, January 1, 2016 | 1252700000 | 6362000000 |
| Sunday, January 1, 2017 | 1337500000 | 7366000000 |
| Monday, January 1, 2018 | 1558400000 | 8359000000 |
| Tuesday, January 1, 2019 | 1601700000 | 8832000000 |
| Wednesday, January 1, 2020 | 1541100000 | 8048000000 |
| Friday, January 1, 2021 | 1662500000 | 8408000000 |
| Saturday, January 1, 2022 | 1949500000 | 9711000000 |
| Sunday, January 1, 2023 | 2069300000 | 9677000000 |
| Monday, January 1, 2024 | 2103700000 |
In pursuit of knowledge
In the ever-evolving landscape of global commerce, understanding the cost of revenue is crucial for evaluating a company's financial health. From 2014 to 2023, Canadian National Railway Company and Allegion plc have shown distinct trajectories in their cost of revenue. Canadian National Railway Company, a titan in the transportation sector, has seen its cost of revenue grow by approximately 36%, peaking in 2022. This reflects the company's strategic investments in infrastructure and technology to enhance efficiency. Meanwhile, Allegion plc, a leader in security solutions, experienced a 72% increase over the same period, indicating robust growth and expansion in its market reach. The data reveals that while both companies have faced challenges, their ability to adapt and innovate has been pivotal in maintaining competitive edges. As we look to the future, these trends offer valuable insights into the strategic directions of these industry leaders.
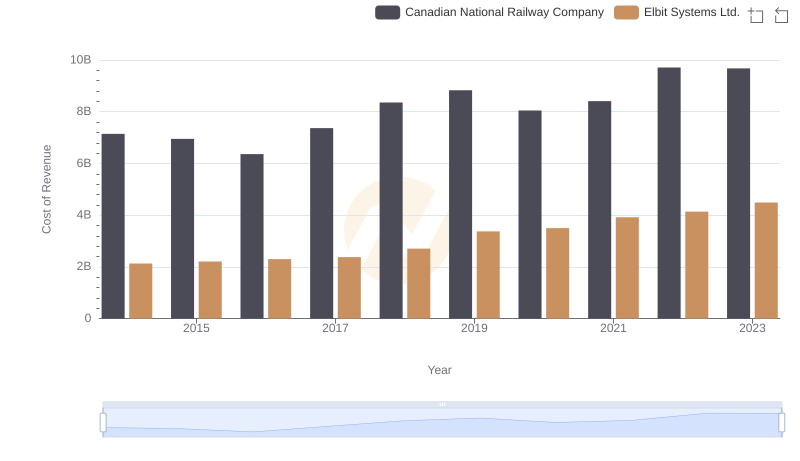
Analyzing Cost of Revenue: Canadian National Railway Company and Elbit Systems Ltd.
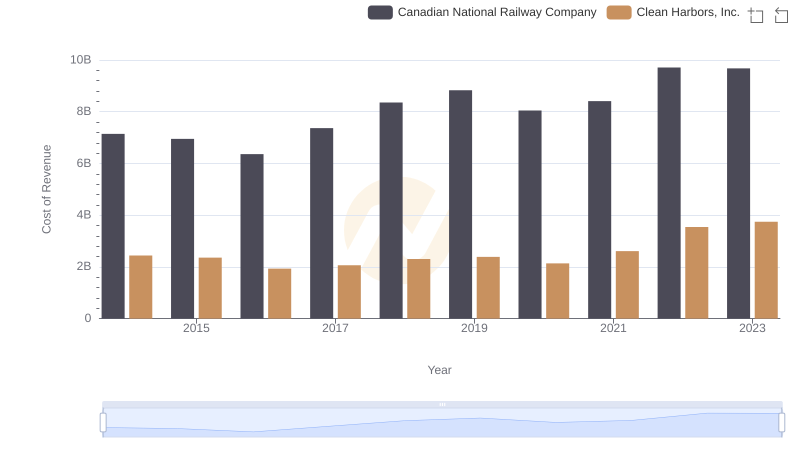
Analyzing Cost of Revenue: Canadian National Railway Company and Clean Harbors, Inc.
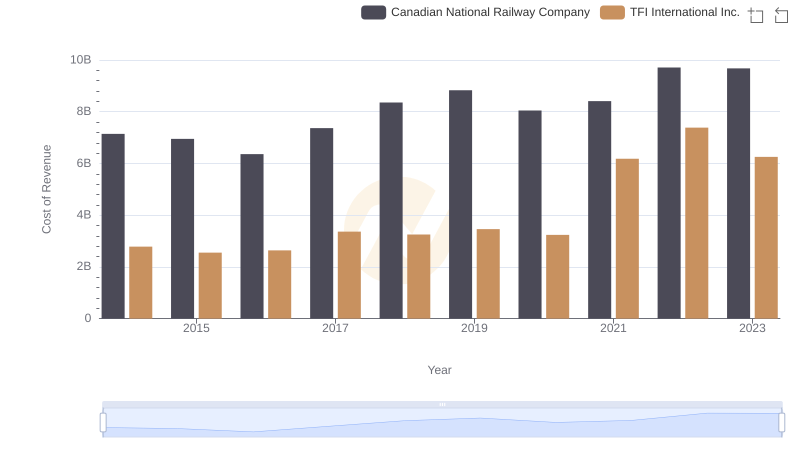
Comparing Cost of Revenue Efficiency: Canadian National Railway Company vs TFI International Inc.
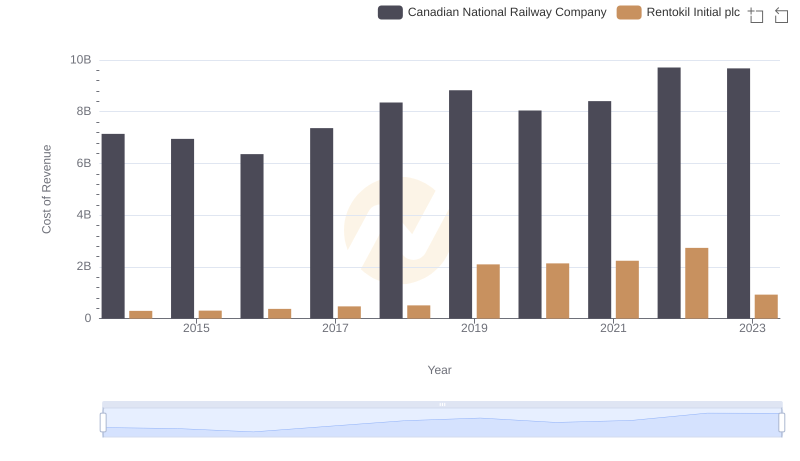
Canadian National Railway Company vs Rentokil Initial plc: Efficiency in Cost of Revenue Explored

Gross Profit Trends Compared: Canadian National Railway Company vs Allegion plc
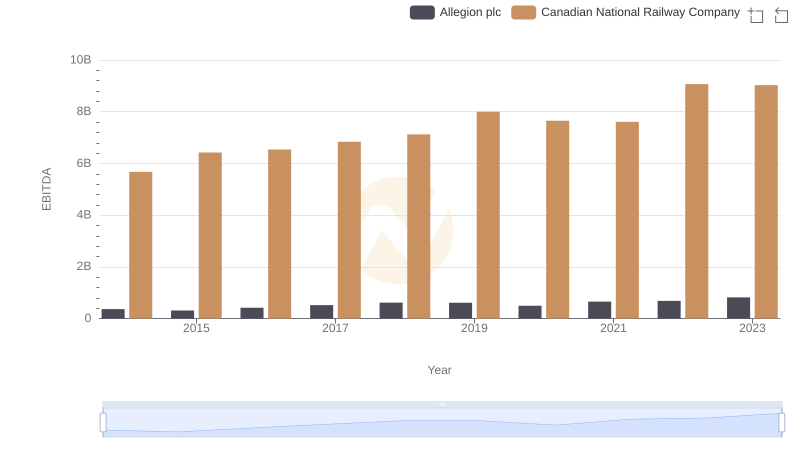
A Side-by-Side Analysis of EBITDA: Canadian National Railway Company and Allegion plc