| __timestamp | AerCap Holdings N.V. | The Boeing Company |
|---|---|---|
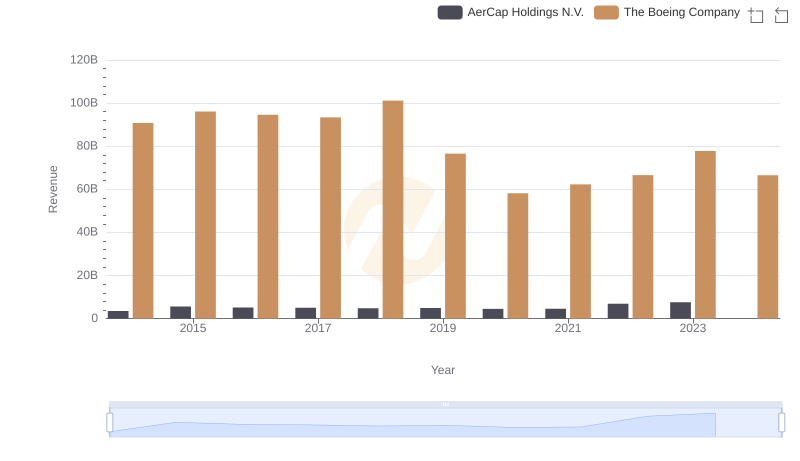
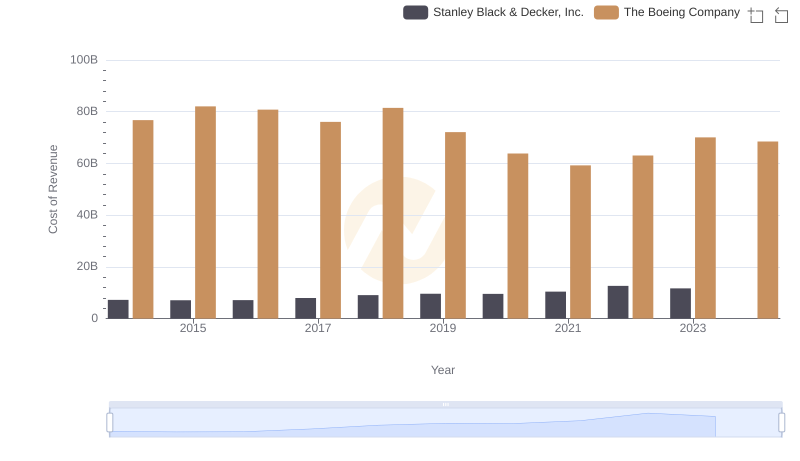
| Wednesday, January 1, 2014 | 2252878000 | 76752000000 |
| Thursday, January 1, 2015 | 3776407000 | 82088000000 |
| Friday, January 1, 2016 | 3465727000 | 80790000000 |
| Sunday, January 1, 2017 | 3377439000 | 76066000000 |
| Monday, January 1, 2018 | 3299635000 | 81490000000 |
| Tuesday, January 1, 2019 | 3259091000 | 72093000000 |
| Wednesday, January 1, 2020 | 3217133000 | 63843000000 |
| Friday, January 1, 2021 | 3287413000 | 59237000000 |
| Saturday, January 1, 2022 | 4805277000 | 63078000000 |
| Sunday, January 1, 2023 | 3237016000 | 70070000000 |
| Monday, January 1, 2024 | 68508000000 |
In pursuit of knowledge
In the competitive world of aerospace and leasing, The Boeing Company and AerCap Holdings N.V. stand as titans. Over the past decade, Boeing's cost of revenue has consistently dwarfed that of AerCap, often exceeding it by more than 20 times. From 2014 to 2023, Boeing's cost of revenue peaked in 2015 at approximately $82 billion, while AerCap's highest was in 2022, reaching nearly $4.8 billion. However, Boeing's costs have shown a downward trend, dropping by about 14% from 2015 to 2023. In contrast, AerCap's costs have remained relatively stable, with a slight increase of around 43% over the same period. The data for 2024 is incomplete, but the trends suggest a continued divergence in their financial strategies. This comparison highlights the distinct operational scales and challenges faced by these industry leaders.