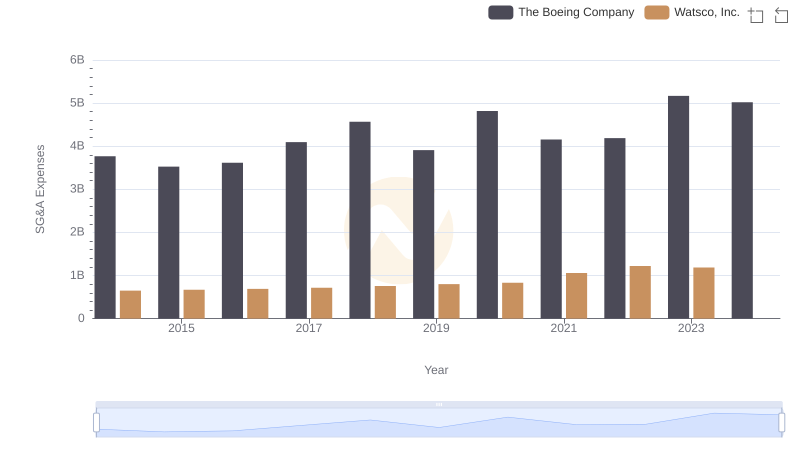
| __timestamp | The Boeing Company | TransUnion |
|---|---|---|
| Wednesday, January 1, 2014 | 3767000000 | 436000000 |
| Thursday, January 1, 2015 | 3525000000 | 499700000 |
| Friday, January 1, 2016 | 3616000000 | 560100000 |
| Sunday, January 1, 2017 | 4094000000 | 585400000 |
| Monday, January 1, 2018 | 4567000000 | 707700000 |
| Tuesday, January 1, 2019 | 3909000000 | 812100000 |
| Wednesday, January 1, 2020 | 4817000000 | 860300000 |
| Friday, January 1, 2021 | 4157000000 | 943900000 |
| Saturday, January 1, 2022 | 4187000000 | 1337400000 |
| Sunday, January 1, 2023 | 5168000000 | 1171600000 |
| Monday, January 1, 2024 | 5021000000 | 1239300000 |
Unleashing insights
In the ever-evolving landscape of corporate finance, understanding cost management is crucial. This analysis delves into the Selling, General, and Administrative (SG&A) expenses of two industry titans: The Boeing Company and TransUnion, from 2014 to 2023. Over this decade, Boeing's SG&A expenses have shown a steady increase, peaking in 2023 with a 37% rise from 2014. In contrast, TransUnion's expenses surged by over 170% during the same period, reflecting its aggressive growth strategy.
This data underscores the strategic financial maneuvers of these companies, offering a window into their operational priorities and market positioning.