| __timestamp | Amphenol Corporation | Gartner, Inc. |
|---|---|---|
| Wednesday, January 1, 2014 | 3651700000 | 797933000 |
| Thursday, January 1, 2015 | 3789200000 | 839076000 |
| Friday, January 1, 2016 | 4246400000 | 945648000 |
| Sunday, January 1, 2017 | 4701400000 | 1320198000 |
| Monday, January 1, 2018 | 5547100000 | 1468800000 |
| Tuesday, January 1, 2019 | 5609400000 | 1550568000 |
| Wednesday, January 1, 2020 | 5934800000 | 1345096000 |
| Friday, January 1, 2021 | 7474500000 | 1444106000 |
| Saturday, January 1, 2022 | 8594800000 | 1693805000 |
| Sunday, January 1, 2023 | 8470600000 | 1903240000 |
| Monday, January 1, 2024 | 10083000000 | 0 |
Unveiling the hidden dimensions of data
In the ever-evolving landscape of corporate finance, understanding cost structures is pivotal. This analysis delves into the cost of revenue trends for Amphenol Corporation and Gartner, Inc. from 2014 to 2023. Amphenol, a leader in electronic components, has seen its cost of revenue surge by approximately 176% over the decade, peaking in 2024. In contrast, Gartner, a global research and advisory firm, experienced a more modest increase of around 138% until 2023. Notably, Amphenol's costs consistently outpaced Gartner's, reflecting its expansive manufacturing operations. The data reveals a missing value for Gartner in 2024, indicating potential reporting delays or strategic shifts. This comparative insight underscores the diverse financial strategies employed by these industry giants, offering a window into their operational efficiencies and market positioning.
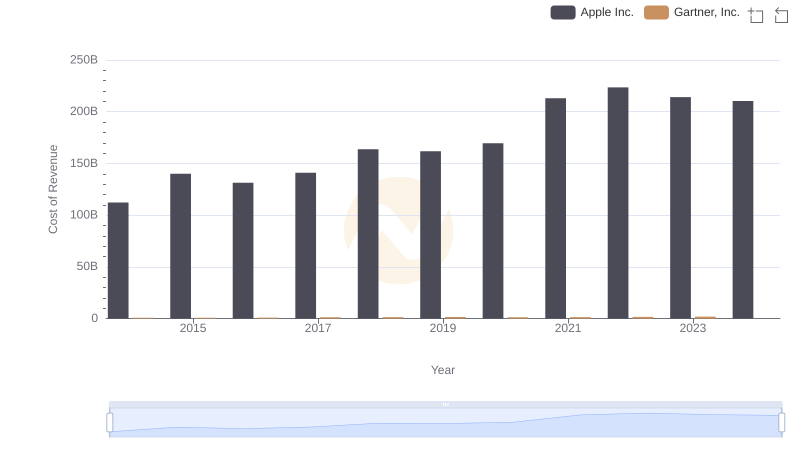
Cost of Revenue Trends: Apple Inc. vs Gartner, Inc.
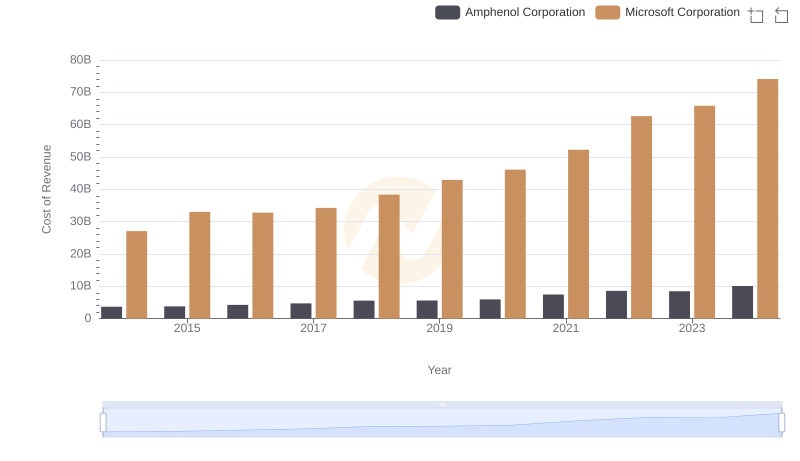
Cost of Revenue: Key Insights for Microsoft Corporation and Amphenol Corporation
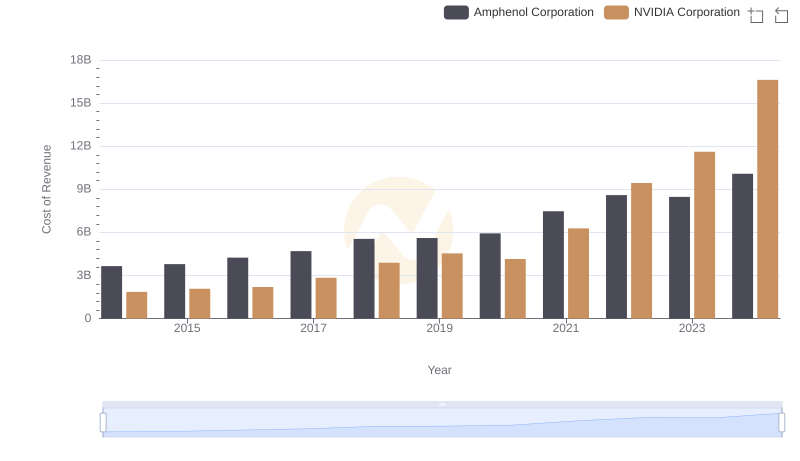
Comparing Cost of Revenue Efficiency: NVIDIA Corporation vs Amphenol Corporation
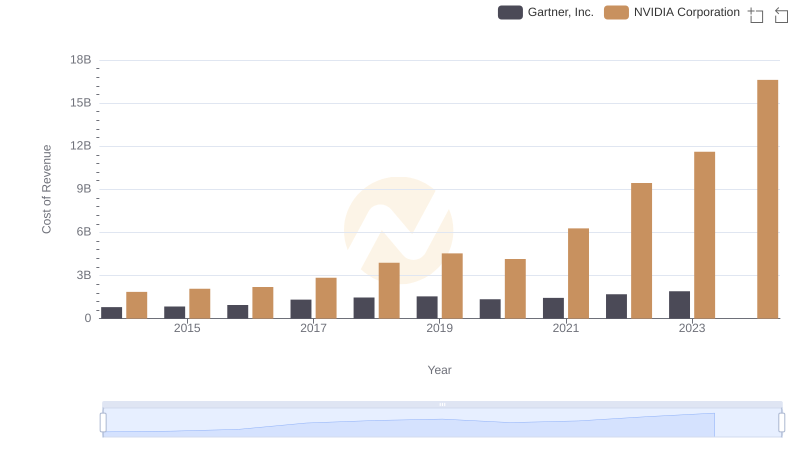
Cost of Revenue: Key Insights for NVIDIA Corporation and Gartner, Inc.
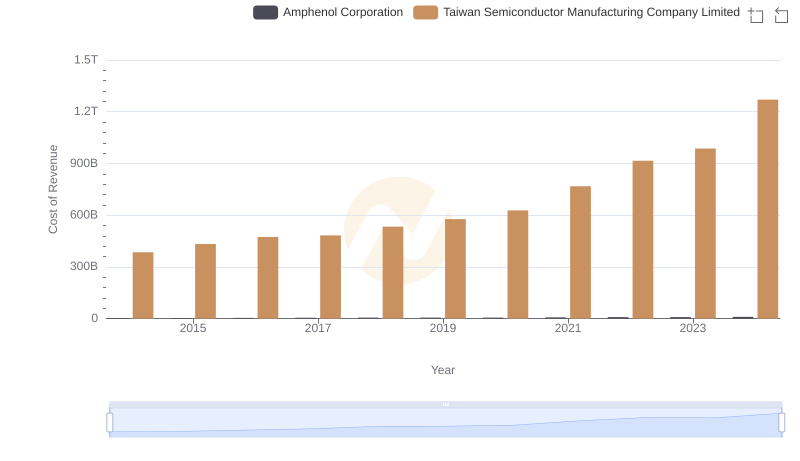
Cost of Revenue: Key Insights for Taiwan Semiconductor Manufacturing Company Limited and Amphenol Corporation
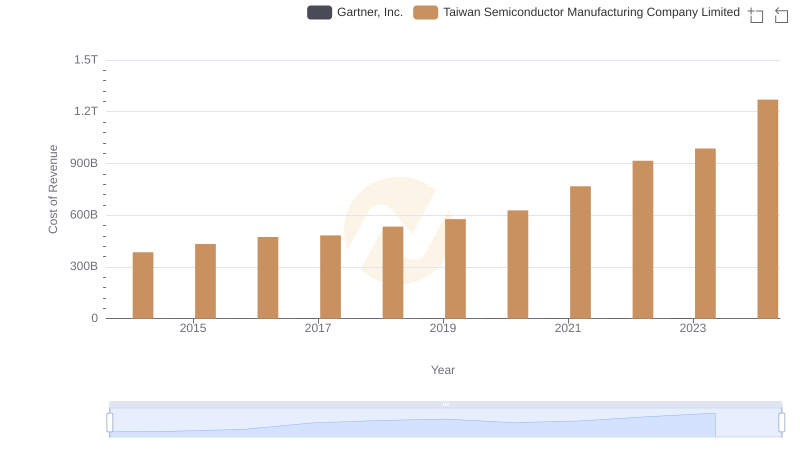
Cost Insights: Breaking Down Taiwan Semiconductor Manufacturing Company Limited and Gartner, Inc.'s Expenses
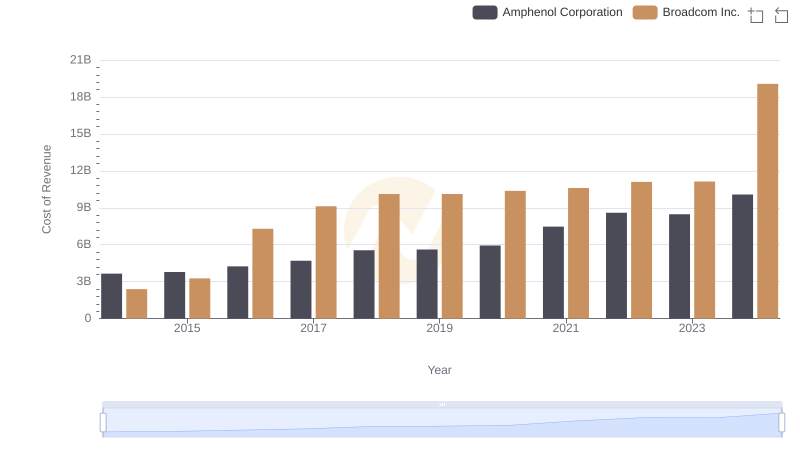
Cost of Revenue Comparison: Broadcom Inc. vs Amphenol Corporation
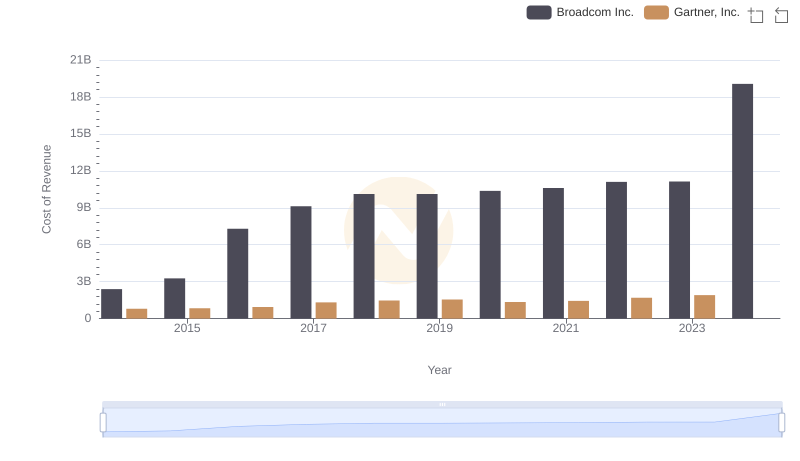
Comparing Cost of Revenue Efficiency: Broadcom Inc. vs Gartner, Inc.
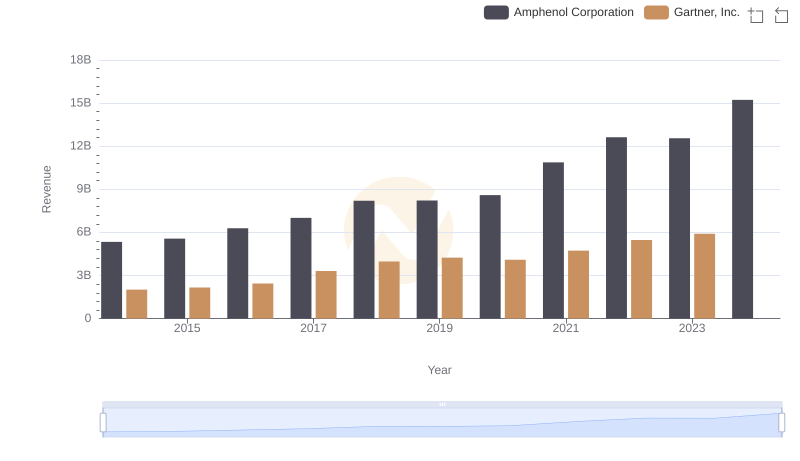
Revenue Showdown: Amphenol Corporation vs Gartner, Inc.
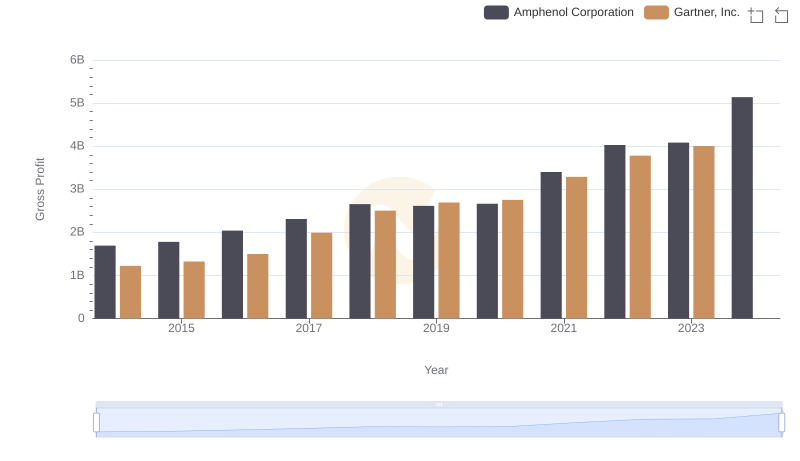
Gross Profit Trends Compared: Amphenol Corporation vs Gartner, Inc.
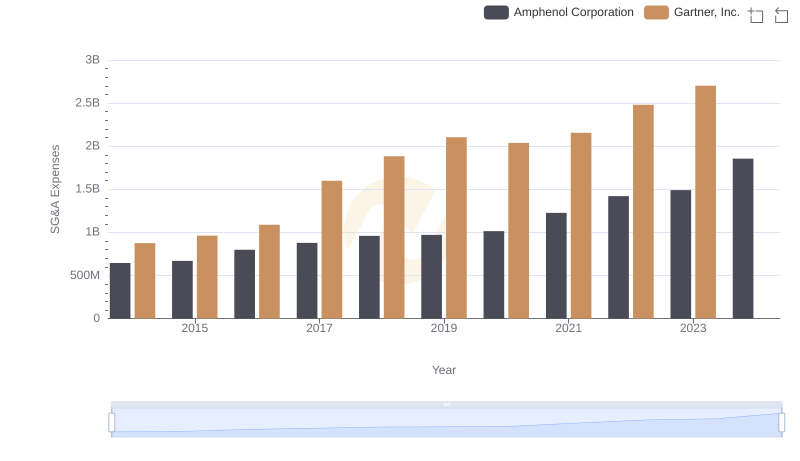
SG&A Efficiency Analysis: Comparing Amphenol Corporation and Gartner, Inc.
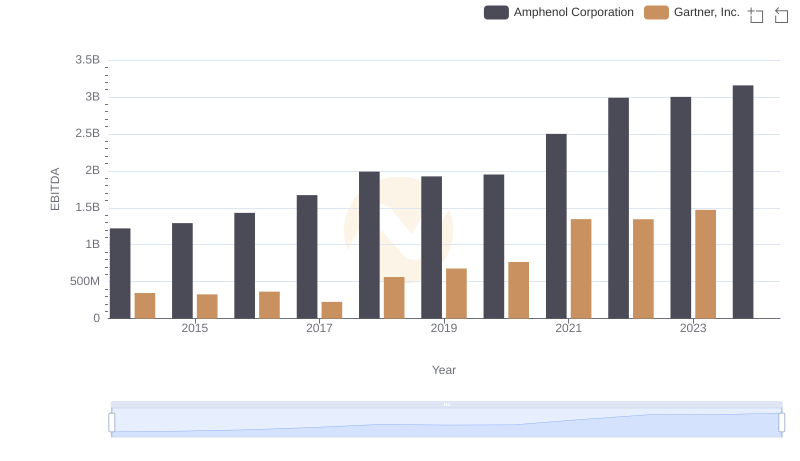
Amphenol Corporation vs Gartner, Inc.: In-Depth EBITDA Performance Comparison