| __timestamp | Amphenol Corporation | Gartner, Inc. |
|---|---|---|
| Wednesday, January 1, 2014 | 645100000 | 876067000 |
| Thursday, January 1, 2015 | 669100000 | 962677000 |
| Friday, January 1, 2016 | 798200000 | 1089184000 |
| Sunday, January 1, 2017 | 878300000 | 1599004000 |
| Monday, January 1, 2018 | 959500000 | 1884141000 |
| Tuesday, January 1, 2019 | 971400000 | 2103424000 |
| Wednesday, January 1, 2020 | 1014200000 | 2039087000 |
| Friday, January 1, 2021 | 1226300000 | 2155724000 |
| Saturday, January 1, 2022 | 1420900000 | 2480846000 |
| Sunday, January 1, 2023 | 1489900000 | 2701542000 |
| Monday, January 1, 2024 | 1855400000 | 2884814000 |
Unlocking the unknown
In the competitive landscape of corporate America, understanding the efficiency of Selling, General, and Administrative (SG&A) expenses is crucial. This analysis compares Amphenol Corporation and Gartner, Inc., two industry leaders, from 2014 to 2023. Over this period, Amphenol's SG&A expenses grew by approximately 187%, while Gartner's expenses surged by about 208%. Notably, Gartner consistently outpaced Amphenol in SG&A spending, peaking in 2023 with a 45% higher expenditure. However, Amphenol's steady growth trajectory, culminating in a 2024 forecast of $1.86 billion, suggests a strategic focus on operational efficiency. The absence of Gartner's 2024 data leaves room for speculation on its future strategy. This comparison highlights the dynamic nature of corporate financial management and the importance of strategic SG&A allocation in maintaining competitive advantage.
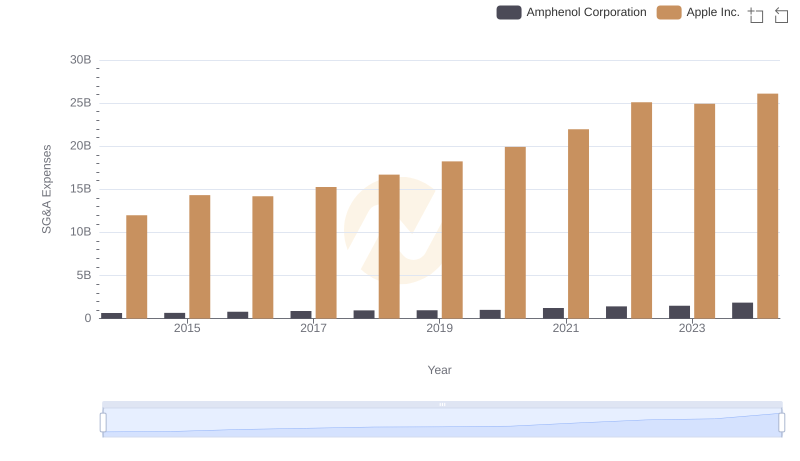
Cost Management Insights: SG&A Expenses for Apple Inc. and Amphenol Corporation
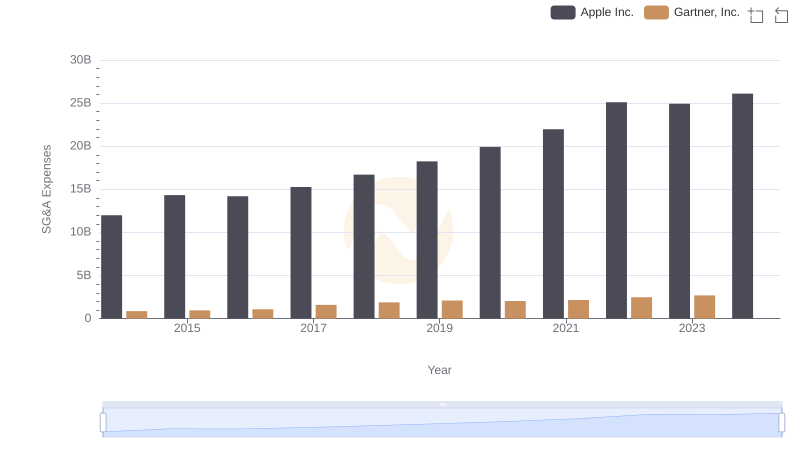
SG&A Efficiency Analysis: Comparing Apple Inc. and Gartner, Inc.
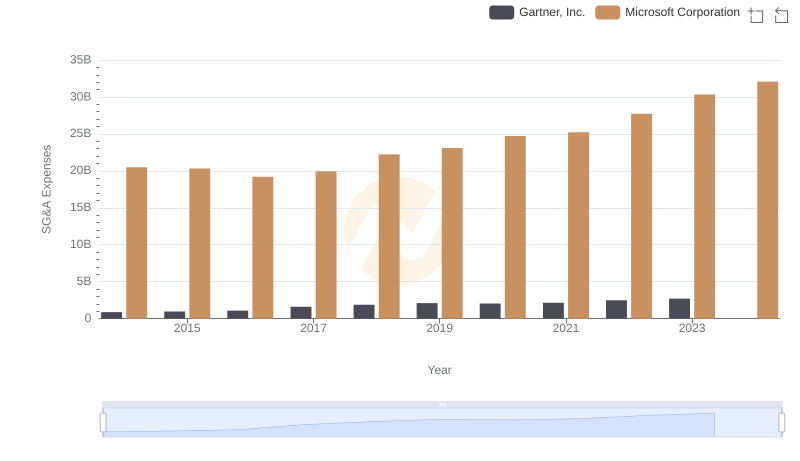
Who Optimizes SG&A Costs Better? Microsoft Corporation or Gartner, Inc.
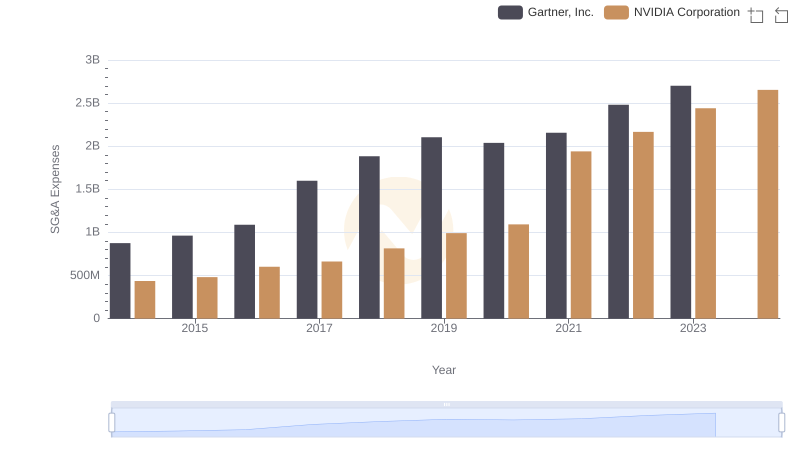
Cost Management Insights: SG&A Expenses for NVIDIA Corporation and Gartner, Inc.
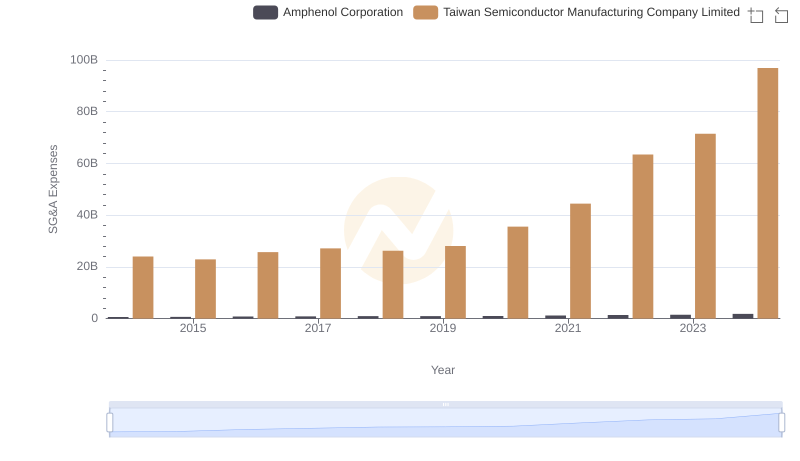
Comparing SG&A Expenses: Taiwan Semiconductor Manufacturing Company Limited vs Amphenol Corporation Trends and Insights
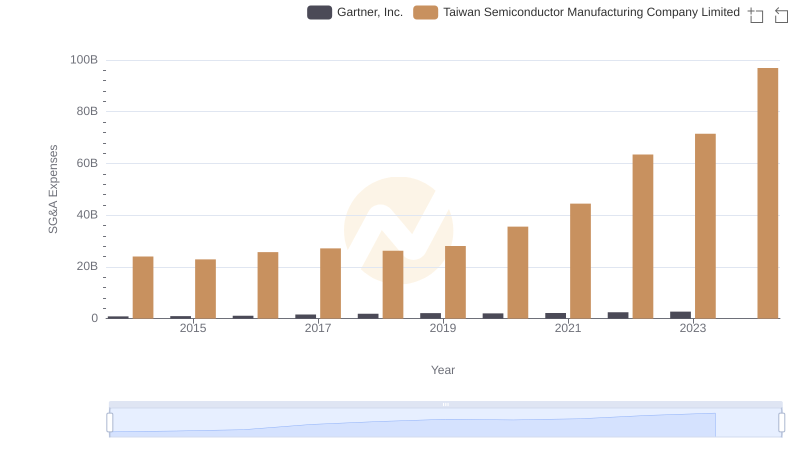
Breaking Down SG&A Expenses: Taiwan Semiconductor Manufacturing Company Limited vs Gartner, Inc.
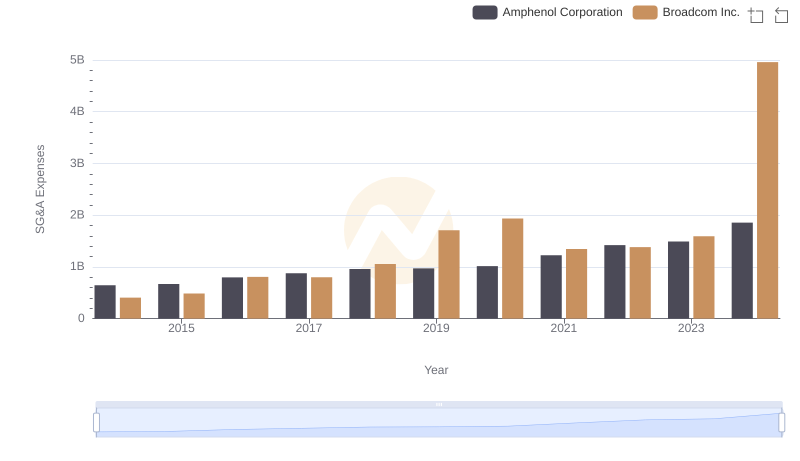
Breaking Down SG&A Expenses: Broadcom Inc. vs Amphenol Corporation
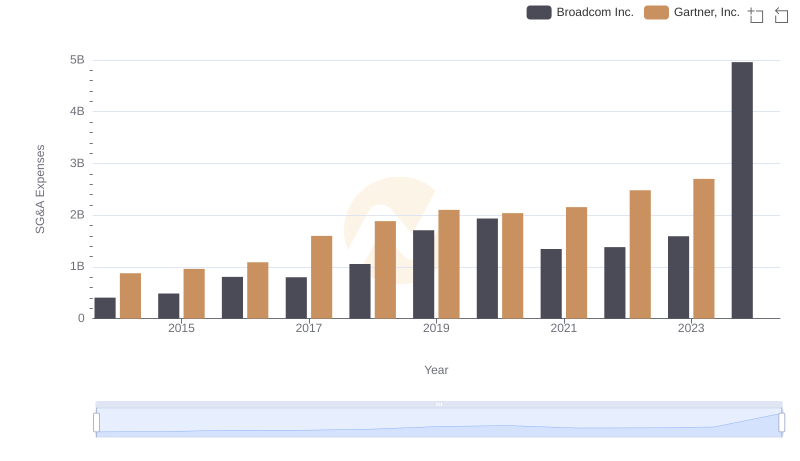
Broadcom Inc. or Gartner, Inc.: Who Manages SG&A Costs Better?
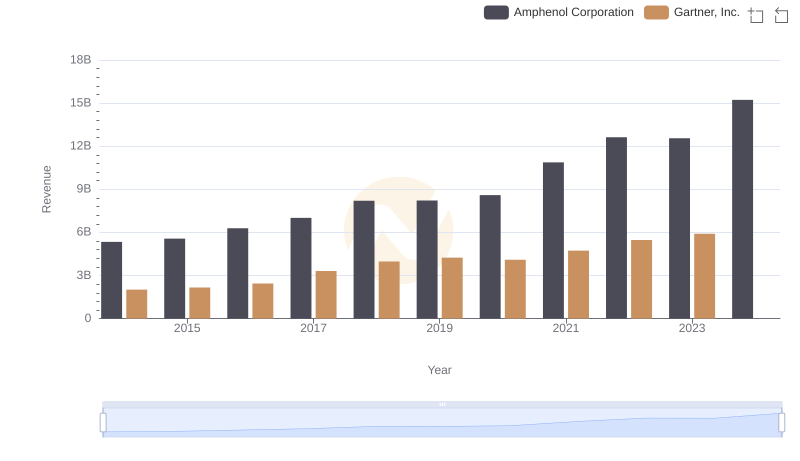
Revenue Showdown: Amphenol Corporation vs Gartner, Inc.
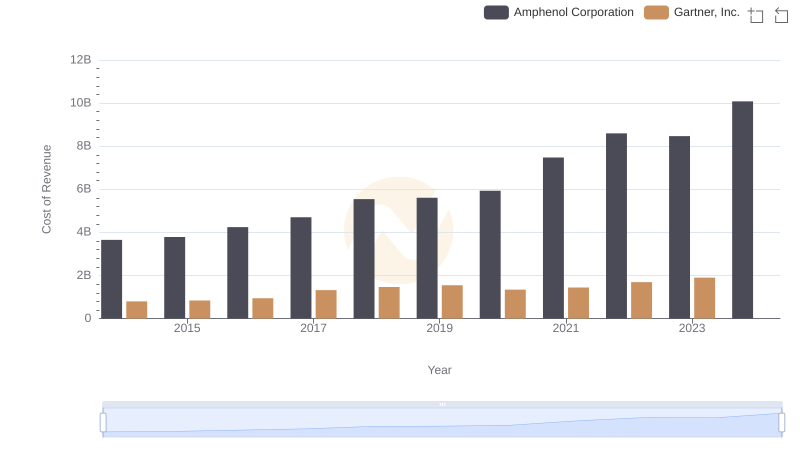
Cost Insights: Breaking Down Amphenol Corporation and Gartner, Inc.'s Expenses
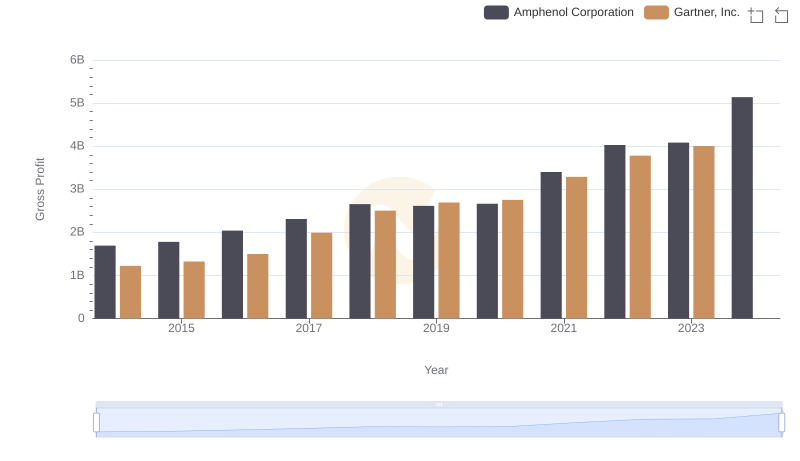
Gross Profit Trends Compared: Amphenol Corporation vs Gartner, Inc.
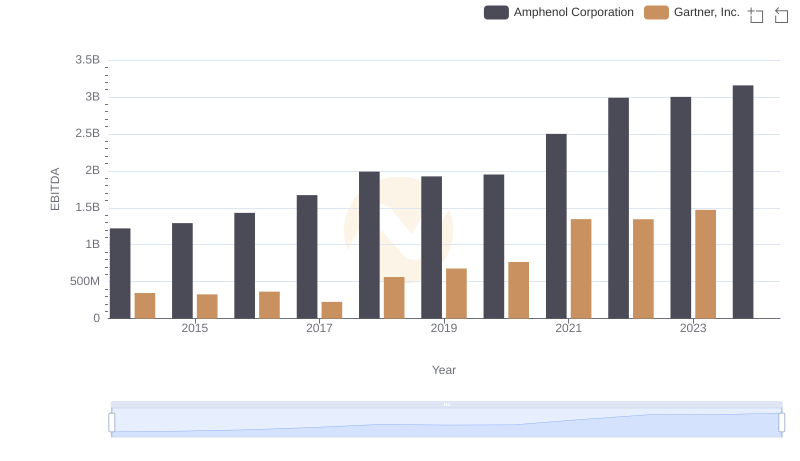
Amphenol Corporation vs Gartner, Inc.: In-Depth EBITDA Performance Comparison