| __timestamp | Amphenol Corporation | Gartner, Inc. |
|---|---|---|
| Wednesday, January 1, 2014 | 1221000000 | 347441000 |
| Thursday, January 1, 2015 | 1292700000 | 328373000 |
| Friday, January 1, 2016 | 1430700000 | 365793000 |
| Sunday, January 1, 2017 | 1671500000 | 227017000 |
| Monday, January 1, 2018 | 1989800000 | 563999000 |
| Tuesday, January 1, 2019 | 1925600000 | 677731000 |
| Wednesday, January 1, 2020 | 1950100000 | 765684000 |
| Friday, January 1, 2021 | 2500300000 | 1346852000 |
| Saturday, January 1, 2022 | 2988700000 | 1345344000 |
| Sunday, January 1, 2023 | 3000700000 | 1471004000 |
| Monday, January 1, 2024 | 3875100000 | 1720735000 |
Unleashing insights
In the ever-evolving landscape of global business, Amphenol Corporation and Gartner, Inc. stand as titans in their respective fields. Over the past decade, Amphenol has consistently outperformed Gartner in terms of EBITDA, showcasing a robust growth trajectory. From 2014 to 2023, Amphenol's EBITDA surged by approximately 146%, reflecting its strategic prowess and market adaptability. In contrast, Gartner's EBITDA, while showing a commendable increase of around 324% from 2014 to 2023, still trails behind Amphenol's financial muscle.
The year 2021 marked a significant leap for both companies, with Amphenol reaching an EBITDA of 2.5 billion and Gartner crossing the 1.3 billion mark. However, the data for 2024 remains incomplete, leaving room for speculation on Gartner's future performance. This comparison not only highlights the financial health of these corporations but also underscores the dynamic nature of the industries they operate in.
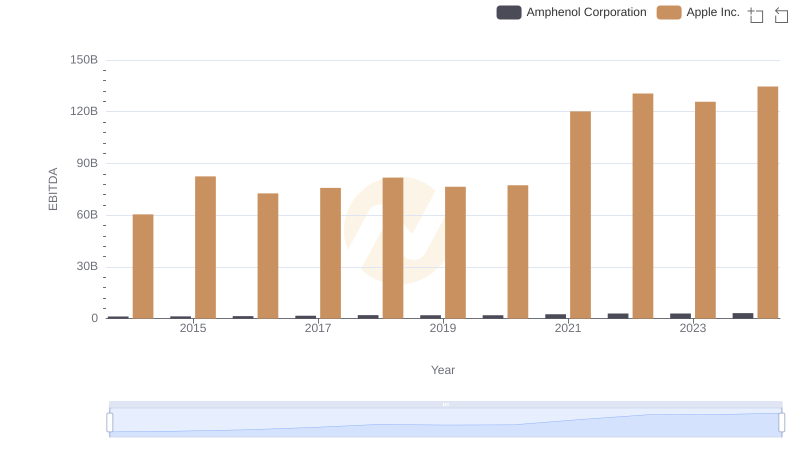
EBITDA Performance Review: Apple Inc. vs Amphenol Corporation
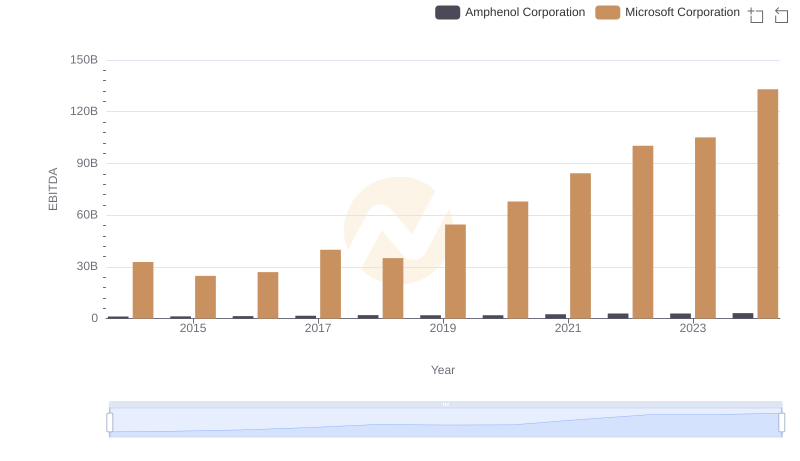
EBITDA Performance Review: Microsoft Corporation vs Amphenol Corporation
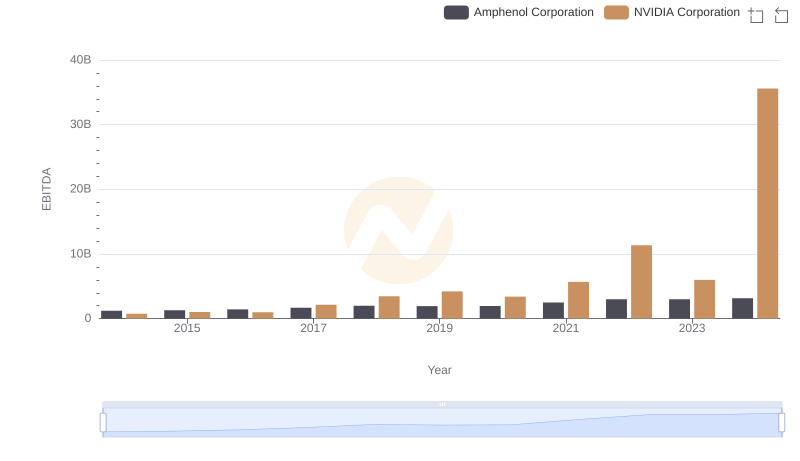
EBITDA Metrics Evaluated: NVIDIA Corporation vs Amphenol Corporation
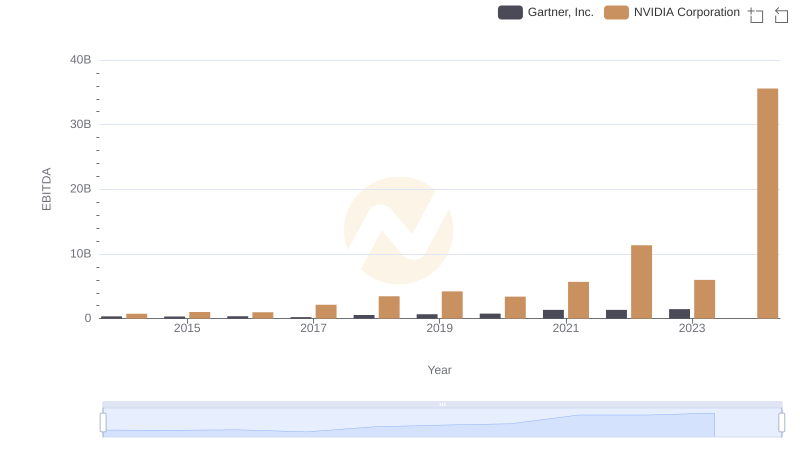
EBITDA Analysis: Evaluating NVIDIA Corporation Against Gartner, Inc.
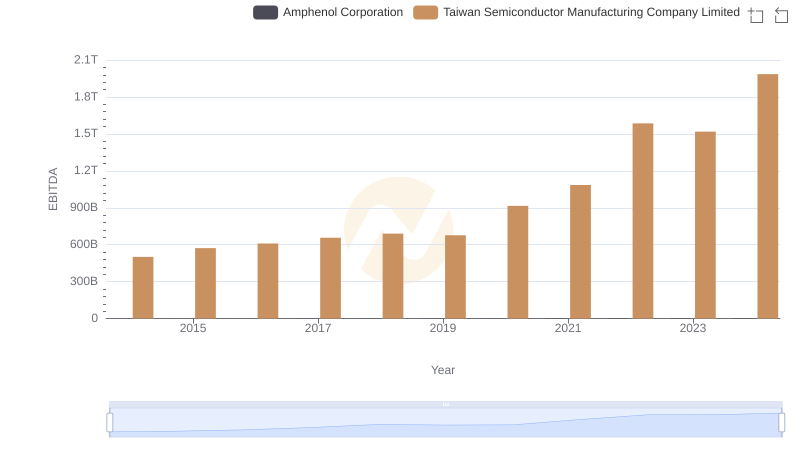
Taiwan Semiconductor Manufacturing Company Limited vs Amphenol Corporation: In-Depth EBITDA Performance Comparison
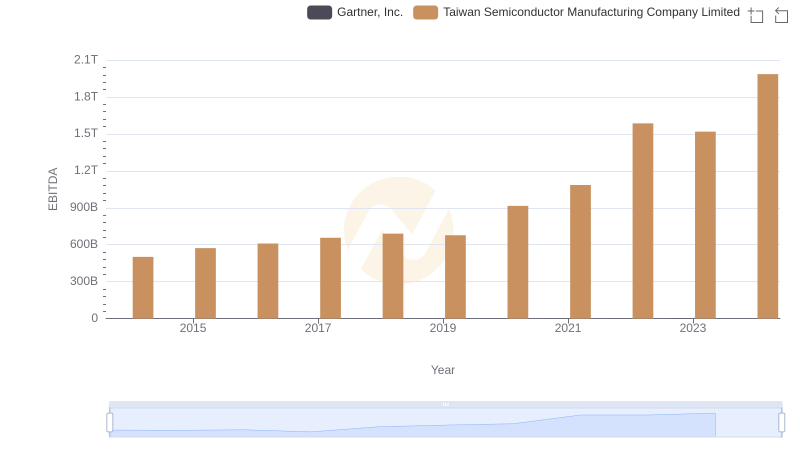
Professional EBITDA Benchmarking: Taiwan Semiconductor Manufacturing Company Limited vs Gartner, Inc.
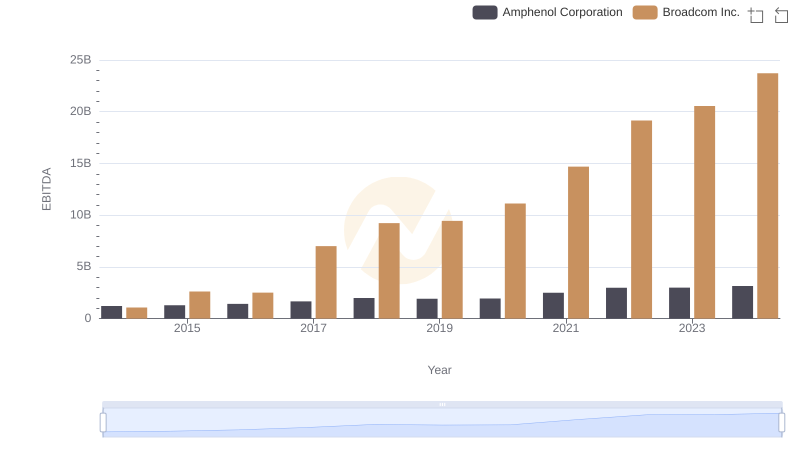
Professional EBITDA Benchmarking: Broadcom Inc. vs Amphenol Corporation
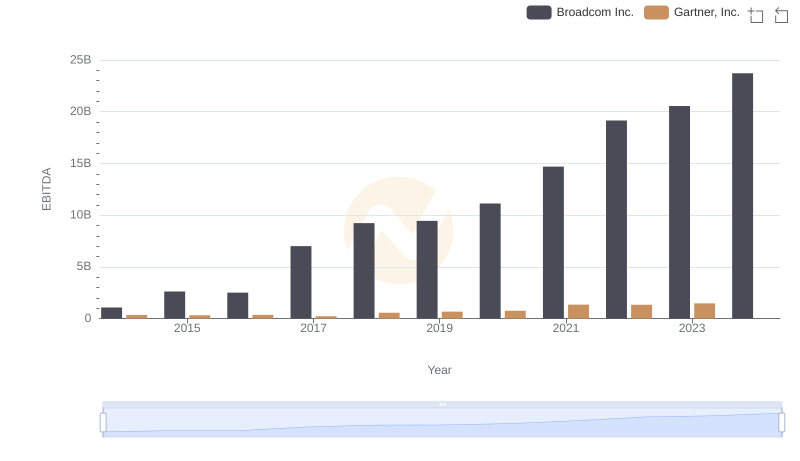
Broadcom Inc. and Gartner, Inc.: A Detailed Examination of EBITDA Performance
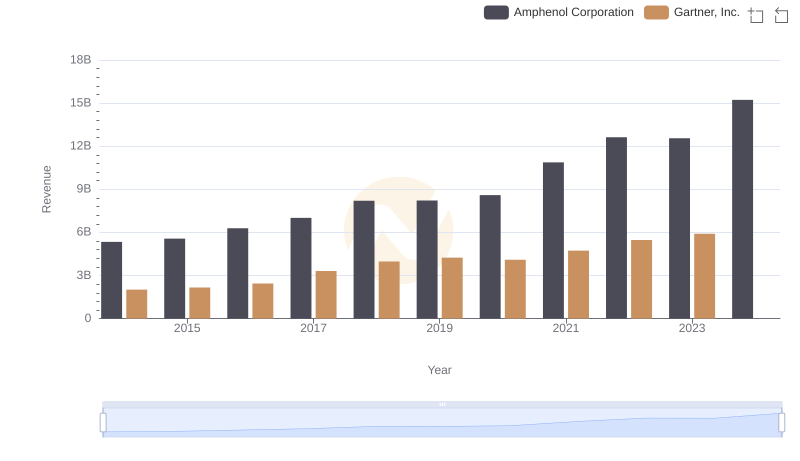
Revenue Showdown: Amphenol Corporation vs Gartner, Inc.
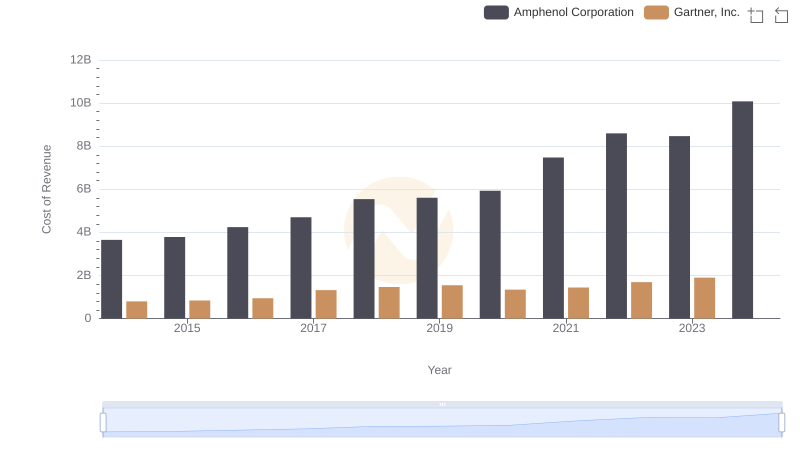
Cost Insights: Breaking Down Amphenol Corporation and Gartner, Inc.'s Expenses
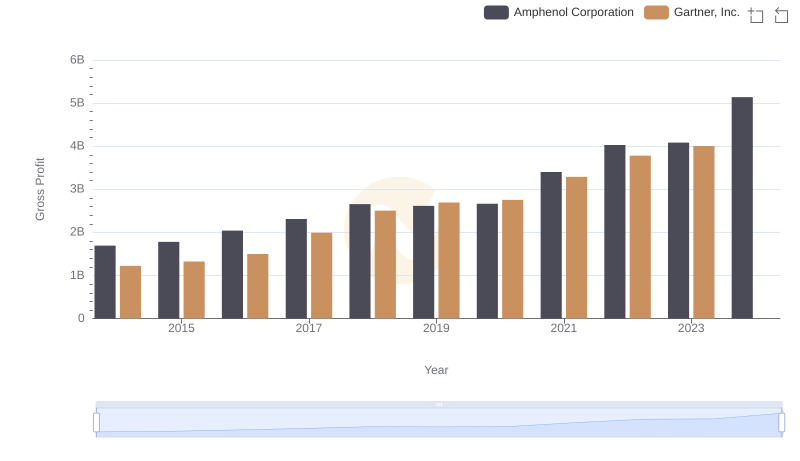
Gross Profit Trends Compared: Amphenol Corporation vs Gartner, Inc.
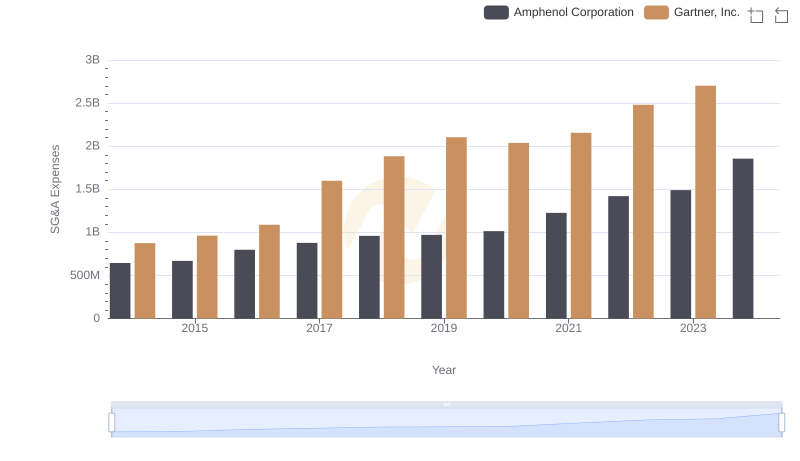
SG&A Efficiency Analysis: Comparing Amphenol Corporation and Gartner, Inc.