| __timestamp | Avery Dennison Corporation | United Airlines Holdings, Inc. |
|---|---|---|
| Wednesday, January 1, 2014 | 6330300000 | 38901000000 |
| Thursday, January 1, 2015 | 5966900000 | 37864000000 |
| Friday, January 1, 2016 | 6086500000 | 36556000000 |
| Sunday, January 1, 2017 | 6613800000 | 37736000000 |
| Monday, January 1, 2018 | 7159000000 | 41303000000 |
| Tuesday, January 1, 2019 | 7070100000 | 43259000000 |
| Wednesday, January 1, 2020 | 6971500000 | 15355000000 |
| Friday, January 1, 2021 | 8408300000 | 24634000000 |
| Saturday, January 1, 2022 | 9039300000 | 44955000000 |
| Sunday, January 1, 2023 | 8364299999 | 53717000000 |
| Monday, January 1, 2024 | 8755700000 | 57063000000 |
Unveiling the hidden dimensions of data
In the ever-evolving landscape of American business, United Airlines Holdings, Inc. and Avery Dennison Corporation stand as titans in their respective industries. Over the past decade, these companies have showcased resilience and adaptability, navigating through economic fluctuations and global challenges.
From 2014 to 2023, United Airlines' revenue trajectory reveals a rollercoaster ride, with a significant dip in 2020, plummeting to just 40% of its 2019 peak. However, by 2023, the airline rebounded impressively, achieving a 250% increase from its 2020 low. In contrast, Avery Dennison's revenue growth has been more stable, with a consistent upward trend, culminating in a 40% increase over the same period.
This comparison underscores the volatility of the airline industry versus the steady growth in the materials sector, offering valuable insights for investors and industry analysts alike.
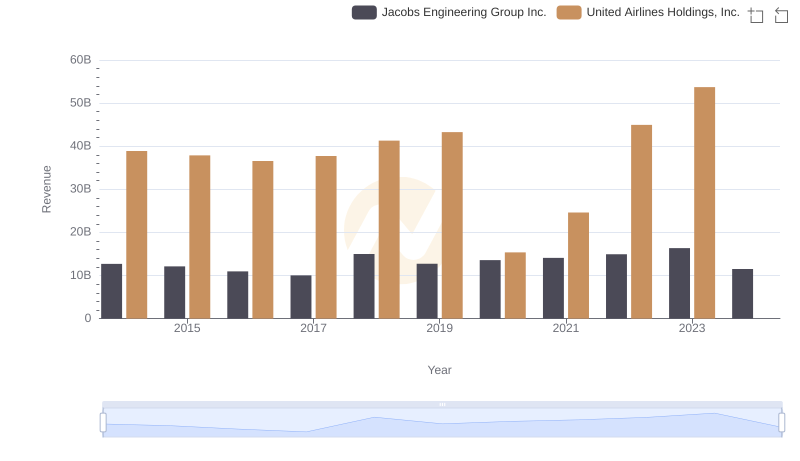
Annual Revenue Comparison: United Airlines Holdings, Inc. vs Jacobs Engineering Group Inc.
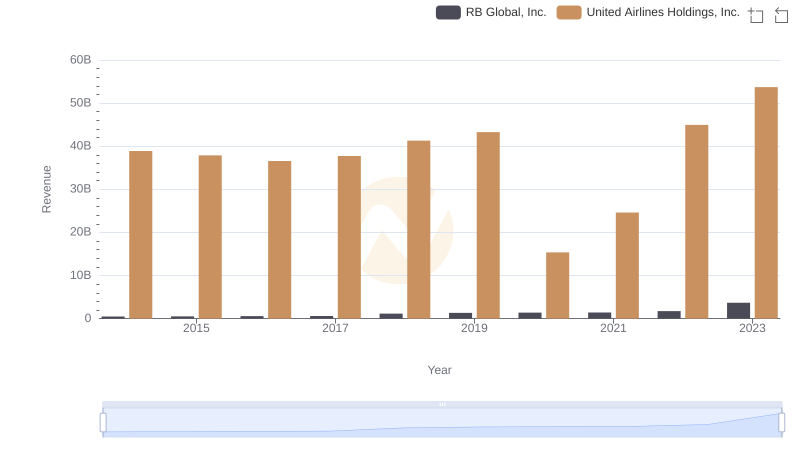
Revenue Insights: United Airlines Holdings, Inc. and RB Global, Inc. Performance Compared
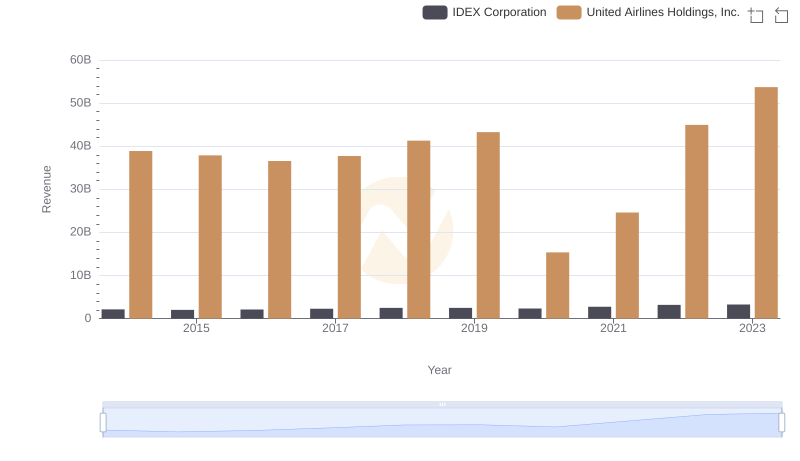
United Airlines Holdings, Inc. vs IDEX Corporation: Annual Revenue Growth Compared
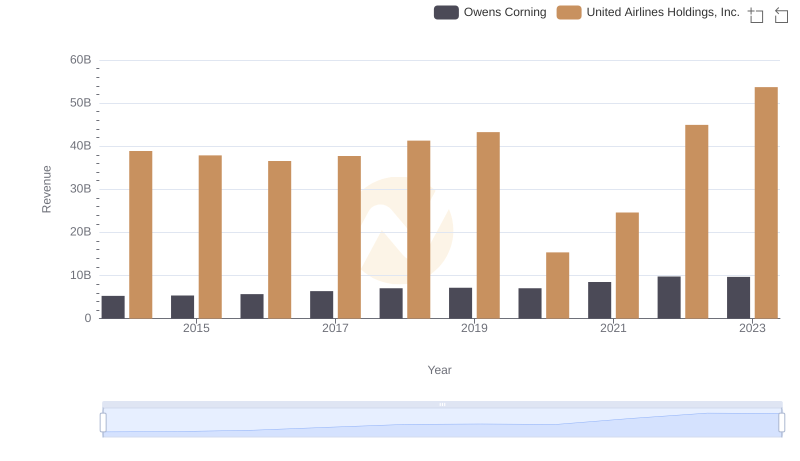
United Airlines Holdings, Inc. or Owens Corning: Who Leads in Yearly Revenue?
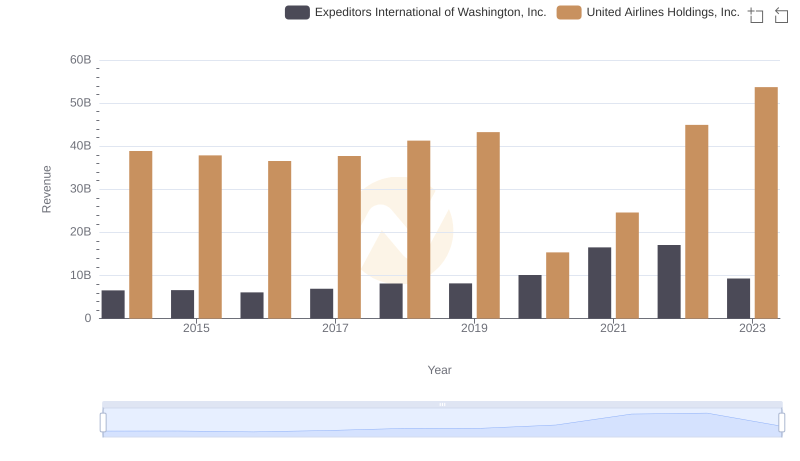
Revenue Insights: United Airlines Holdings, Inc. and Expeditors International of Washington, Inc. Performance Compared
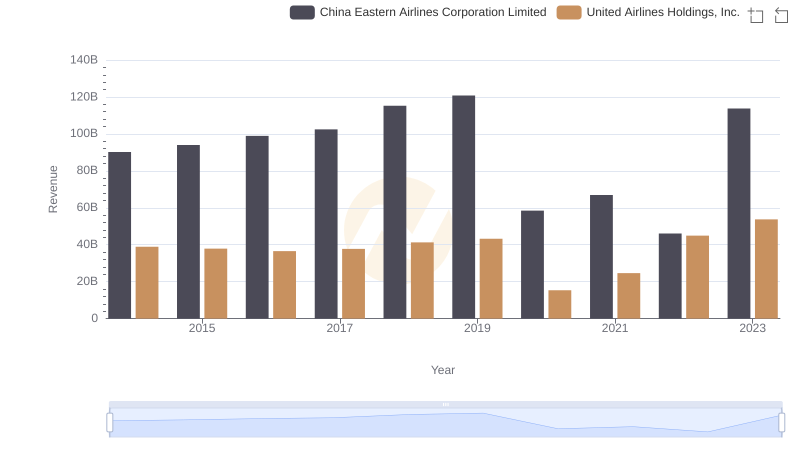
Comparing Revenue Performance: United Airlines Holdings, Inc. or China Eastern Airlines Corporation Limited?
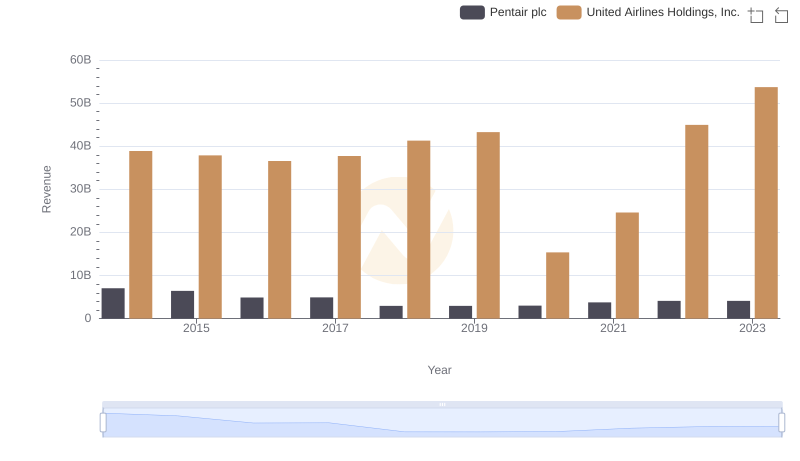
Revenue Insights: United Airlines Holdings, Inc. and Pentair plc Performance Compared
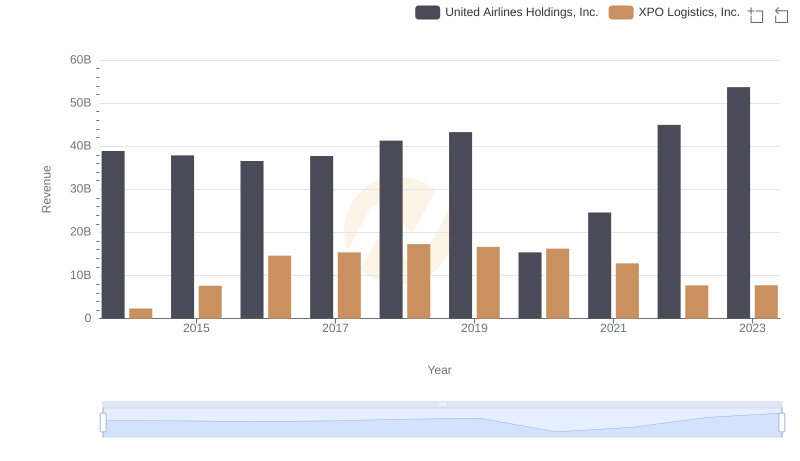
Comparing Revenue Performance: United Airlines Holdings, Inc. or XPO Logistics, Inc.?
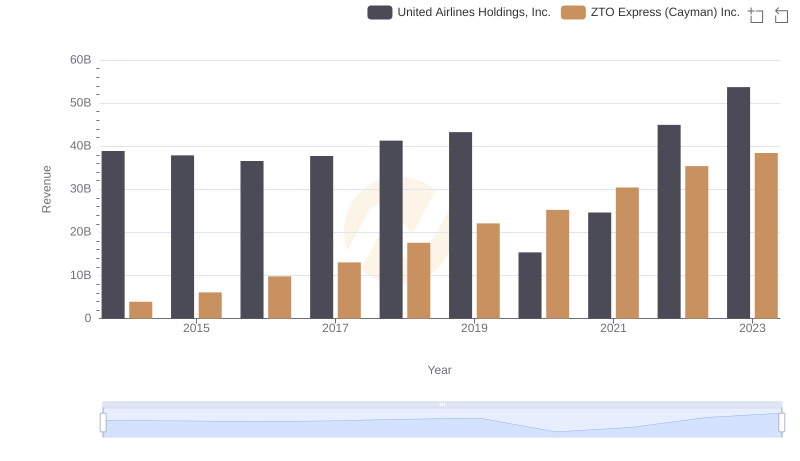
Revenue Showdown: United Airlines Holdings, Inc. vs ZTO Express (Cayman) Inc.