| __timestamp | Roper Technologies, Inc. | United Parcel Service, Inc. |
|---|---|---|
| Wednesday, January 1, 2014 | 1199557000 | 9055000000 |
| Thursday, January 1, 2015 | 1238079000 | 9870000000 |
| Friday, January 1, 2016 | 1290510000 | 9740000000 |
| Sunday, January 1, 2017 | 1558802000 | 9611000000 |
| Monday, January 1, 2018 | 1746500000 | 9292000000 |
| Tuesday, January 1, 2019 | 2827900000 | 10194000000 |
| Wednesday, January 1, 2020 | 1782800000 | 10366000000 |
| Friday, January 1, 2021 | 1951500000 | 15821000000 |
| Saturday, January 1, 2022 | 2124500000 | 17005000000 |
| Sunday, January 1, 2023 | 2663000000 | 12714000000 |
| Monday, January 1, 2024 | 1996800000 | 10185000000 |
Unveiling the hidden dimensions of data
In the ever-evolving landscape of global commerce, United Parcel Service, Inc. (UPS) and Roper Technologies, Inc. stand as titans in their respective fields. From 2014 to 2023, UPS consistently outperformed Roper in EBITDA, showcasing its robust operational efficiency. In 2022, UPS's EBITDA peaked at approximately $17 billion, a staggering 700% higher than Roper's $2.1 billion. However, Roper demonstrated impressive growth, with a 122% increase in EBITDA from 2014 to 2023, compared to UPS's 40% growth. This data highlights UPS's dominance in logistics and Roper's strategic advancements in technology. As we look to the future, these trends underscore the dynamic nature of industry leadership and the importance of strategic innovation.

United Parcel Service, Inc. vs Roper Technologies, Inc.: Annual Revenue Growth Compared
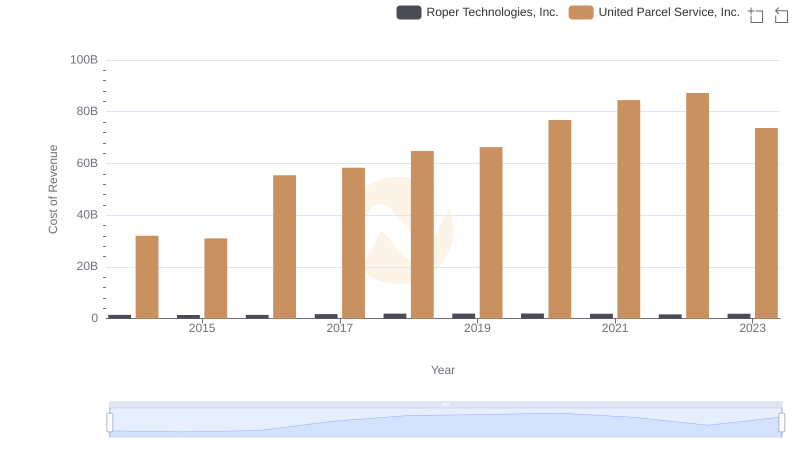
Cost Insights: Breaking Down United Parcel Service, Inc. and Roper Technologies, Inc.'s Expenses
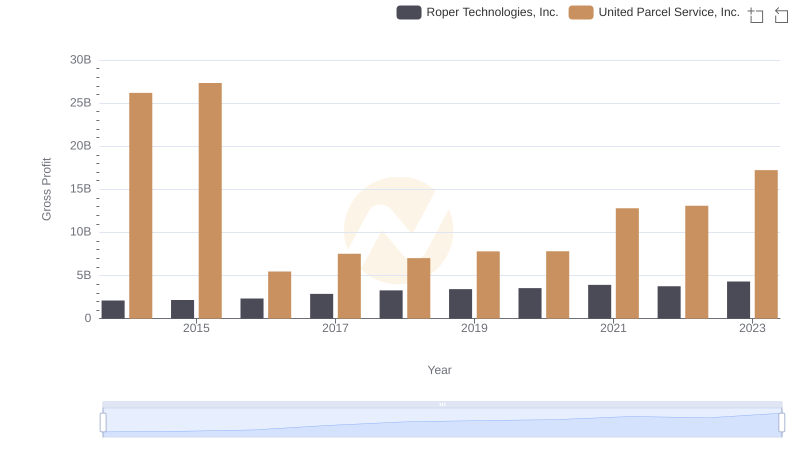
United Parcel Service, Inc. vs Roper Technologies, Inc.: A Gross Profit Performance Breakdown
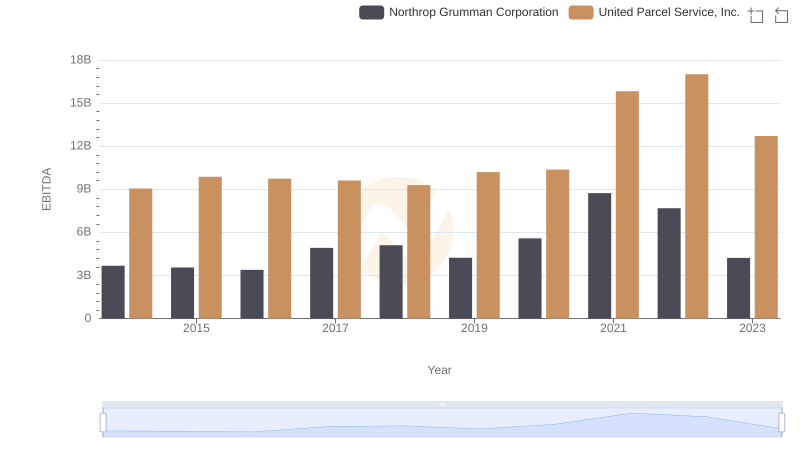
Professional EBITDA Benchmarking: United Parcel Service, Inc. vs Northrop Grumman Corporation
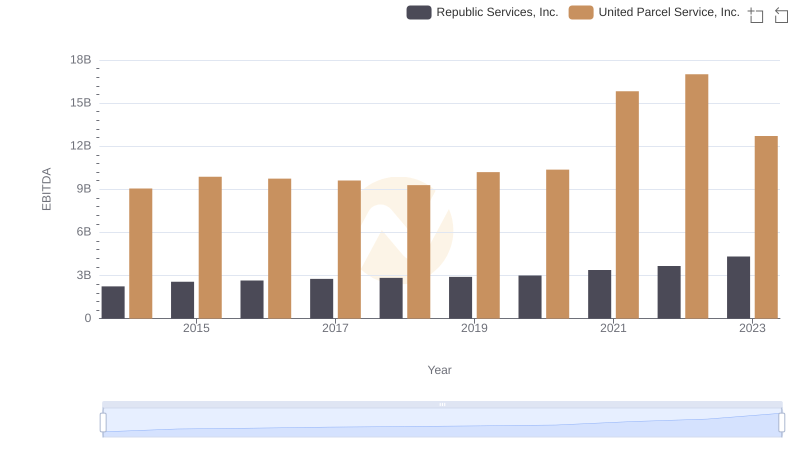
EBITDA Performance Review: United Parcel Service, Inc. vs Republic Services, Inc.

EBITDA Performance Review: United Parcel Service, Inc. vs Norfolk Southern Corporation
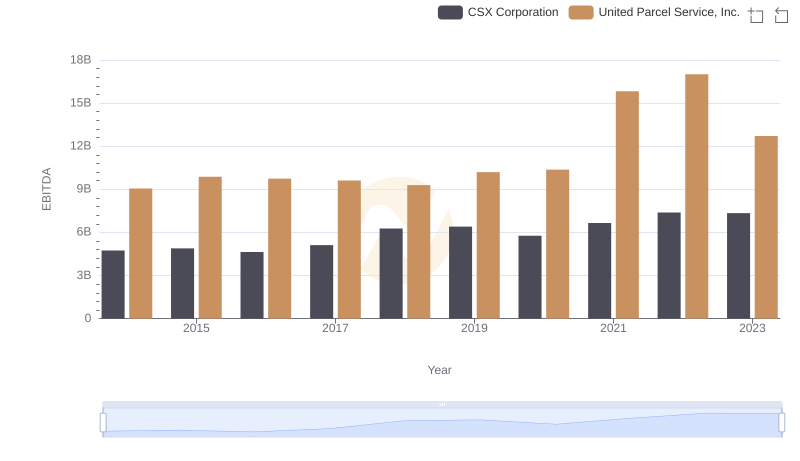
EBITDA Metrics Evaluated: United Parcel Service, Inc. vs CSX Corporation
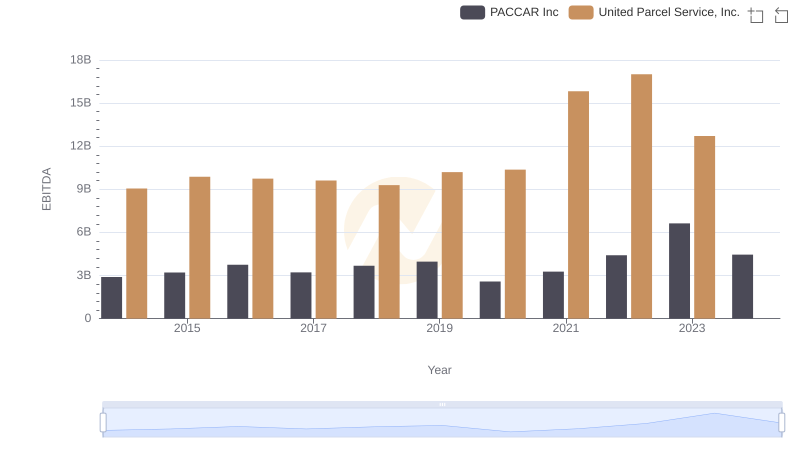
Comprehensive EBITDA Comparison: United Parcel Service, Inc. vs PACCAR Inc
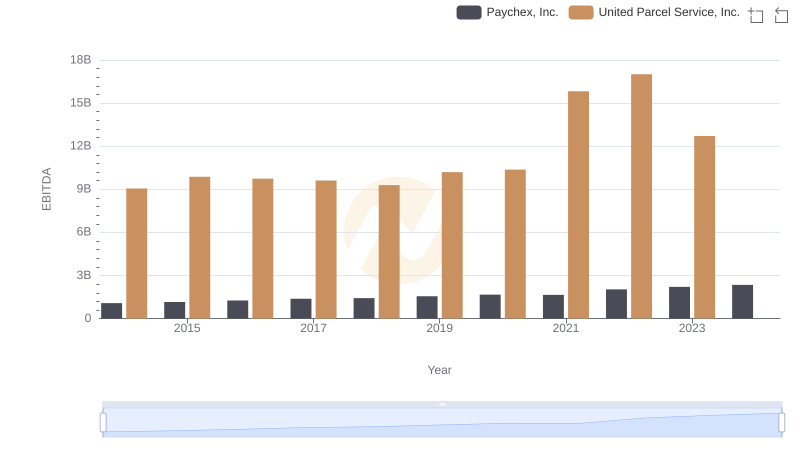
A Professional Review of EBITDA: United Parcel Service, Inc. Compared to Paychex, Inc.
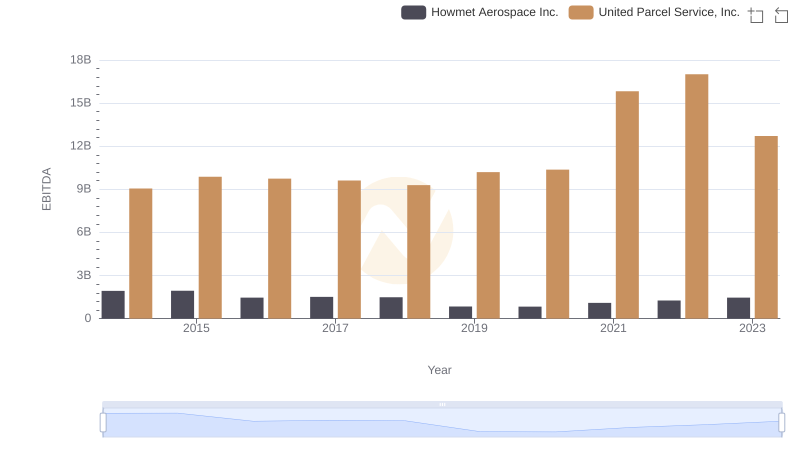
Professional EBITDA Benchmarking: United Parcel Service, Inc. vs Howmet Aerospace Inc.