| __timestamp | PACCAR Inc | United Parcel Service, Inc. |
|---|---|---|
| Wednesday, January 1, 2014 | 2896200000 | 9055000000 |
| Thursday, January 1, 2015 | 3212900000 | 9870000000 |
| Friday, January 1, 2016 | 3745900000 | 9740000000 |
| Sunday, January 1, 2017 | 3215800000 | 9611000000 |
| Monday, January 1, 2018 | 3681700000 | 9292000000 |
| Tuesday, January 1, 2019 | 3969900000 | 10194000000 |
| Wednesday, January 1, 2020 | 2581000000 | 10366000000 |
| Friday, January 1, 2021 | 3268200000 | 15821000000 |
| Saturday, January 1, 2022 | 4407800000 | 17005000000 |
| Sunday, January 1, 2023 | 6626900000 | 12714000000 |
| Monday, January 1, 2024 | 4456800000 | 10185000000 |
Infusing magic into the data realm
In the ever-evolving landscape of logistics and manufacturing, United Parcel Service, Inc. (UPS) and PACCAR Inc have been industry stalwarts. Over the past decade, UPS has consistently outperformed PACCAR in terms of EBITDA, showcasing its robust operational efficiency. From 2014 to 2023, UPS's EBITDA grew by approximately 40%, peaking in 2022. In contrast, PACCAR's EBITDA saw a more volatile trajectory, with a significant spike in 2023, reaching nearly 70% higher than its 2014 value. This surge highlights PACCAR's resilience and adaptability in a competitive market. However, the data for 2024 is incomplete, leaving room for speculation on future trends. As these giants continue to innovate, stakeholders and investors keenly observe their financial health, making EBITDA a critical metric for assessing long-term viability.

Who Generates More Revenue? United Parcel Service, Inc. or PACCAR Inc
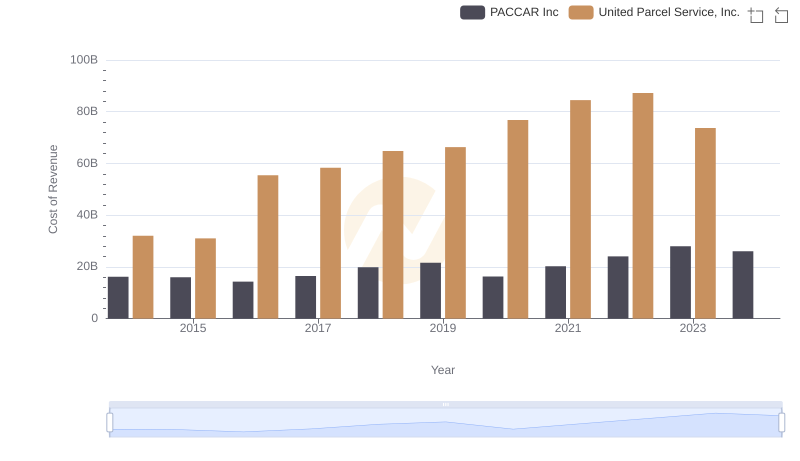
Cost Insights: Breaking Down United Parcel Service, Inc. and PACCAR Inc's Expenses
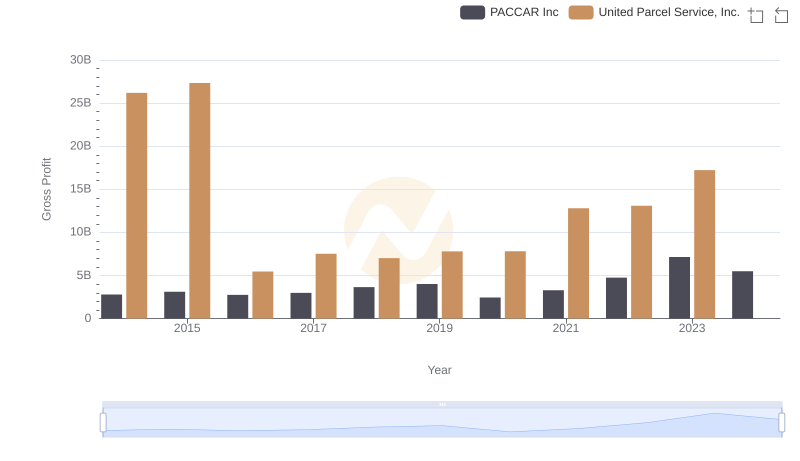
United Parcel Service, Inc. and PACCAR Inc: A Detailed Gross Profit Analysis
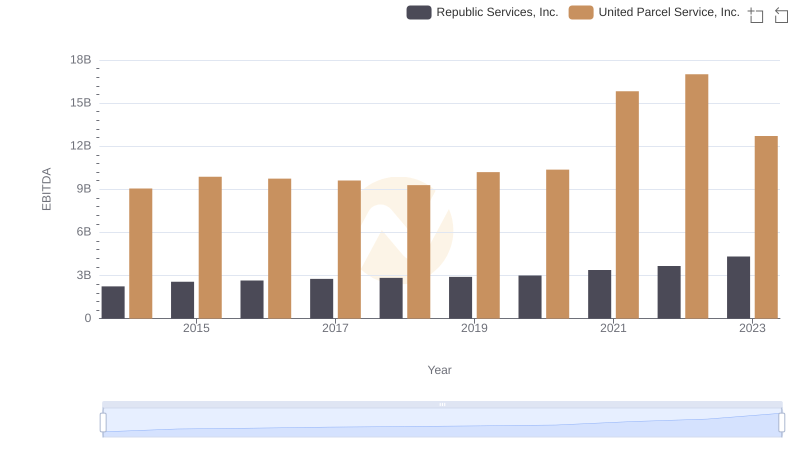
EBITDA Performance Review: United Parcel Service, Inc. vs Republic Services, Inc.

EBITDA Performance Review: United Parcel Service, Inc. vs Norfolk Southern Corporation
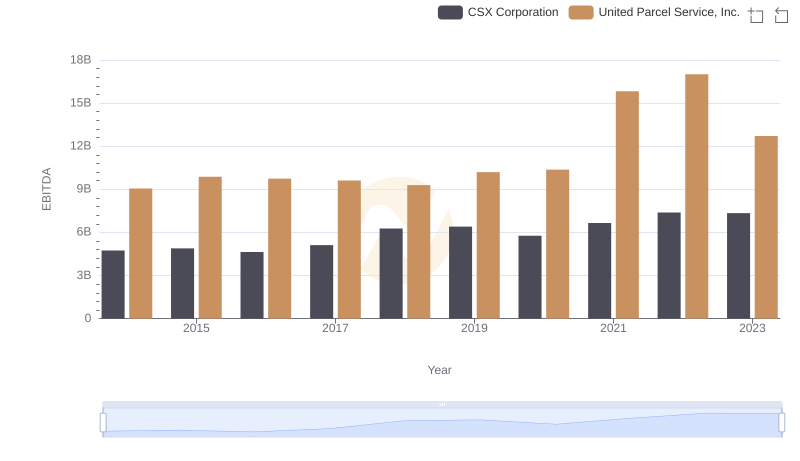
EBITDA Metrics Evaluated: United Parcel Service, Inc. vs CSX Corporation
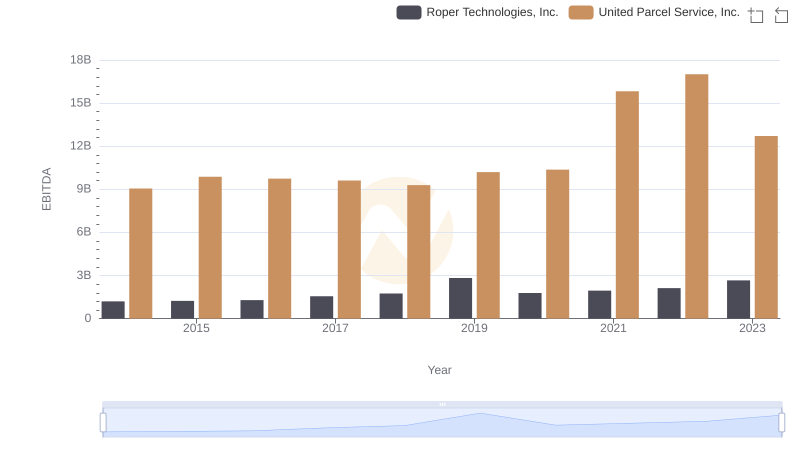
United Parcel Service, Inc. vs Roper Technologies, Inc.: In-Depth EBITDA Performance Comparison
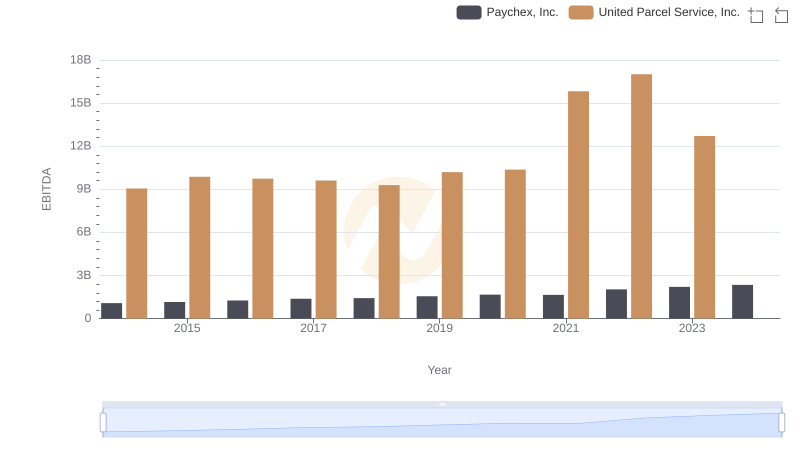
A Professional Review of EBITDA: United Parcel Service, Inc. Compared to Paychex, Inc.
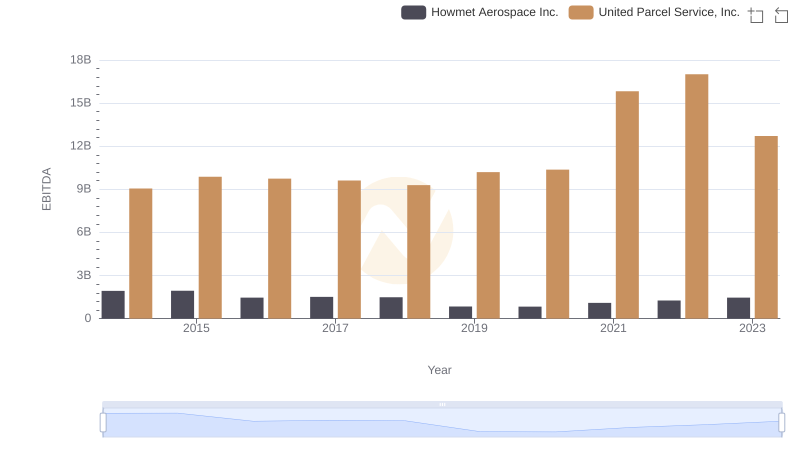
Professional EBITDA Benchmarking: United Parcel Service, Inc. vs Howmet Aerospace Inc.
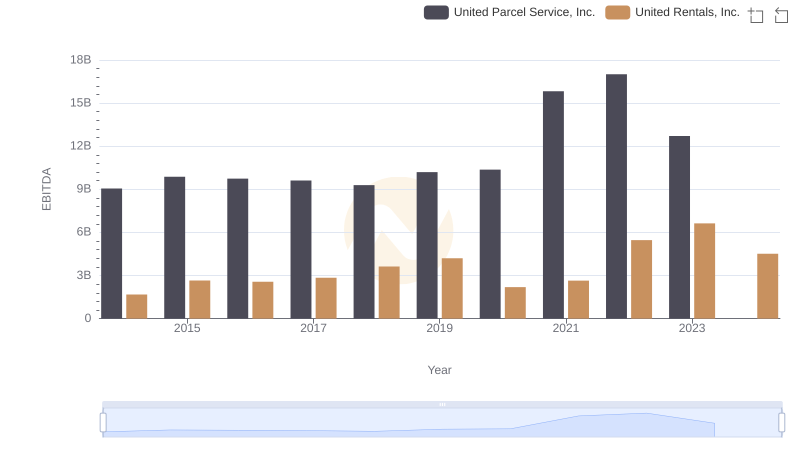
United Parcel Service, Inc. vs United Rentals, Inc.: In-Depth EBITDA Performance Comparison