| __timestamp | AMETEK, Inc. | United Parcel Service, Inc. |
|---|---|---|
| Wednesday, January 1, 2014 | 1023344000 | 9055000000 |
| Thursday, January 1, 2015 | 1093776000 | 9870000000 |
| Friday, January 1, 2016 | 1007213000 | 9740000000 |
| Sunday, January 1, 2017 | 1068174000 | 9611000000 |
| Monday, January 1, 2018 | 1269415000 | 9292000000 |
| Tuesday, January 1, 2019 | 1411422000 | 10194000000 |
| Wednesday, January 1, 2020 | 1283159000 | 10366000000 |
| Friday, January 1, 2021 | 1600782000 | 15821000000 |
| Saturday, January 1, 2022 | 1820119000 | 17005000000 |
| Sunday, January 1, 2023 | 2025843000 | 12714000000 |
| Monday, January 1, 2024 | 1779562000 | 10185000000 |
In pursuit of knowledge
In the ever-evolving landscape of corporate finance, EBITDA serves as a crucial indicator of a company's operational efficiency. From 2014 to 2023, United Parcel Service, Inc. (UPS) and AMETEK, Inc. have demonstrated intriguing trends in their EBITDA performance.
UPS, a global leader in logistics, showcased a robust growth trajectory, peaking in 2022 with a 70% increase from its 2014 figures. However, 2023 saw a dip, bringing EBITDA down by approximately 25% from the previous year. In contrast, AMETEK, Inc., a leading manufacturer of electronic instruments, exhibited a steady climb, culminating in a 98% rise over the same period.
This analysis underscores the dynamic nature of these industries, highlighting UPS's sensitivity to market fluctuations and AMETEK's consistent growth strategy. Investors and analysts should consider these trends when evaluating future prospects.
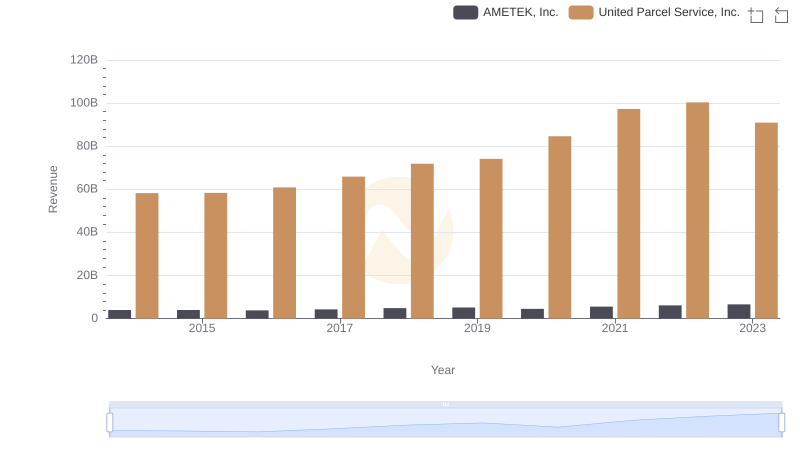
United Parcel Service, Inc. vs AMETEK, Inc.: Annual Revenue Growth Compared

Cost Insights: Breaking Down United Parcel Service, Inc. and AMETEK, Inc.'s Expenses
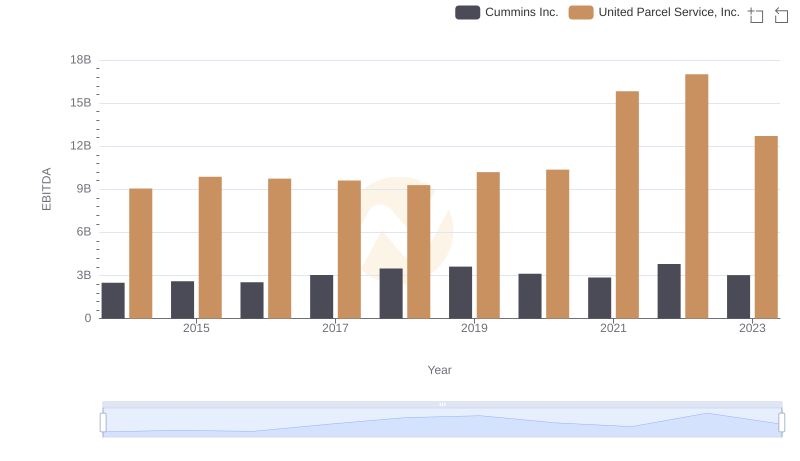
EBITDA Metrics Evaluated: United Parcel Service, Inc. vs Cummins Inc.
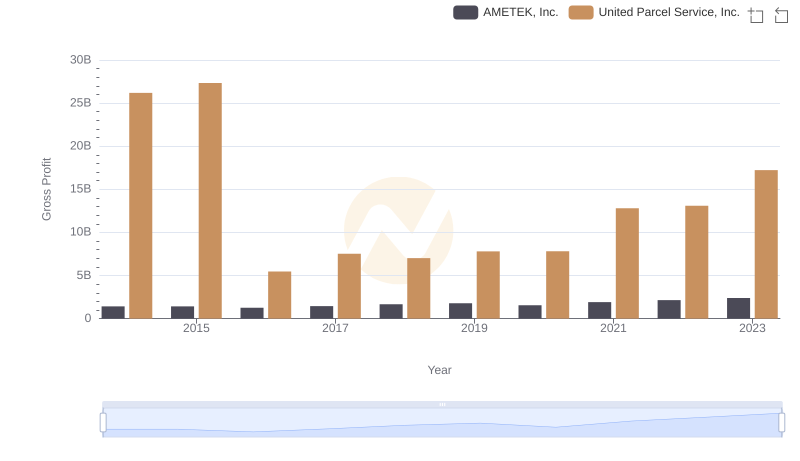
United Parcel Service, Inc. and AMETEK, Inc.: A Detailed Gross Profit Analysis

Comparative EBITDA Analysis: United Parcel Service, Inc. vs Fastenal Company
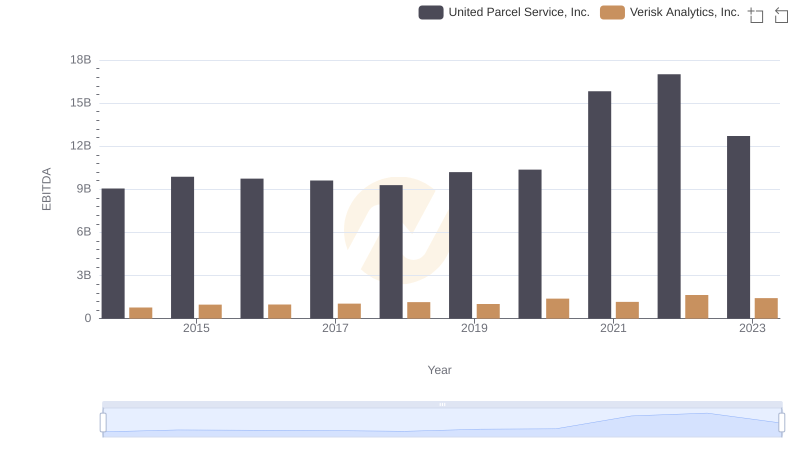
United Parcel Service, Inc. vs Verisk Analytics, Inc.: In-Depth EBITDA Performance Comparison
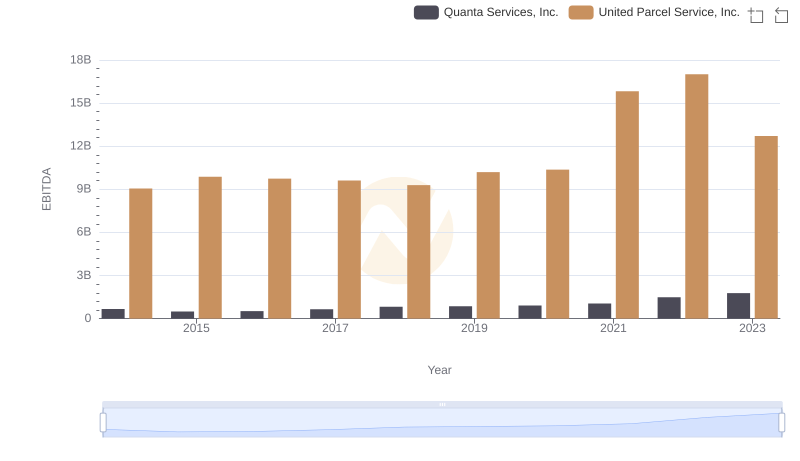
United Parcel Service, Inc. vs Quanta Services, Inc.: In-Depth EBITDA Performance Comparison
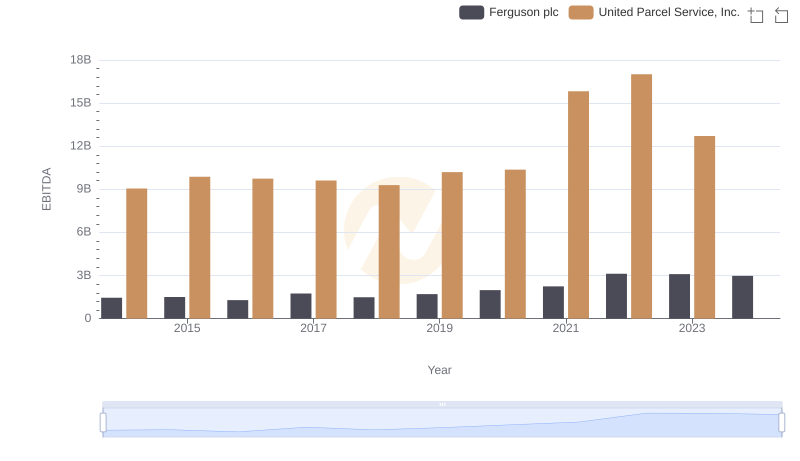
EBITDA Performance Review: United Parcel Service, Inc. vs Ferguson plc
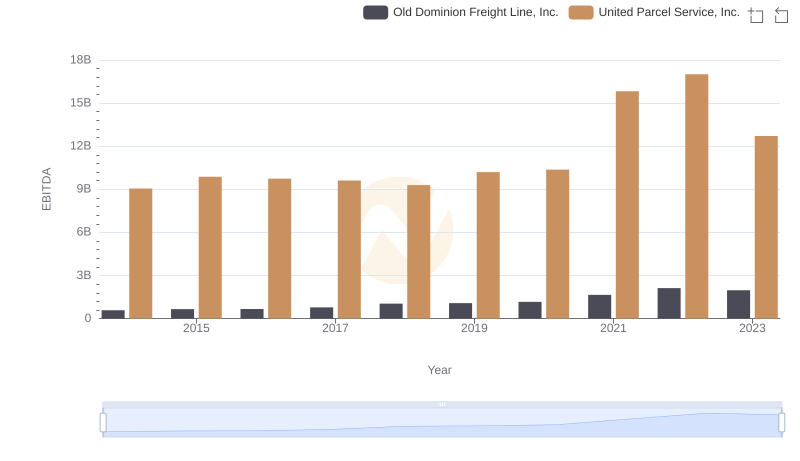
Professional EBITDA Benchmarking: United Parcel Service, Inc. vs Old Dominion Freight Line, Inc.
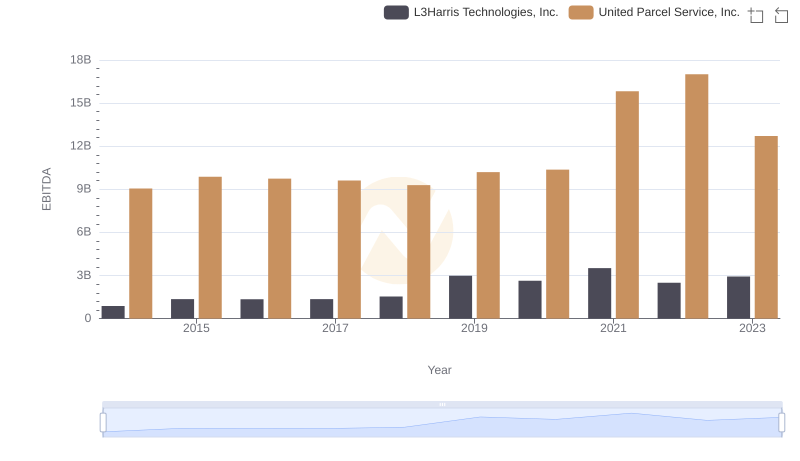
A Side-by-Side Analysis of EBITDA: United Parcel Service, Inc. and L3Harris Technologies, Inc.

United Parcel Service, Inc. and Westinghouse Air Brake Technologies Corporation: A Detailed Examination of EBITDA Performance