| __timestamp | Jacobs Engineering Group Inc. | TransUnion |
|---|---|---|
| Wednesday, January 1, 2014 | 12695157000 | 1304700000 |
| Thursday, January 1, 2015 | 12114832000 | 1506800000 |
| Friday, January 1, 2016 | 10964157000 | 1704900000 |
| Sunday, January 1, 2017 | 10022788000 | 1933800000 |
| Monday, January 1, 2018 | 14984646000 | 2317200000 |
| Tuesday, January 1, 2019 | 12737868000 | 2656100000 |
| Wednesday, January 1, 2020 | 13566975000 | 2716600000 |
| Friday, January 1, 2021 | 14092632000 | 2960200000 |
| Saturday, January 1, 2022 | 14922825000 | 3709900000 |
| Sunday, January 1, 2023 | 16352414000 | 3831200000 |
| Monday, January 1, 2024 | 11500941000 | 4183800000 |
Unveiling the hidden dimensions of data
In the ever-evolving landscape of American business, TransUnion and Jacobs Engineering Group Inc. stand as titans in their respective fields. Over the past decade, these companies have showcased contrasting revenue trajectories. From 2014 to 2023, Jacobs Engineering Group Inc. experienced a steady revenue growth, peaking in 2023 with a 29% increase from its 2014 figures. Meanwhile, TransUnion's revenue surged by an impressive 194% over the same period, reflecting its dynamic expansion in the financial services sector.
However, 2024 presents a curious anomaly with Jacobs Engineering's revenue dropping significantly, while TransUnion's data remains elusive. This missing data invites speculation about market conditions and strategic shifts. As we delve into these financial narratives, the numbers tell a story of resilience, adaptation, and the relentless pursuit of growth in a competitive market.

Who Generates More Revenue? TransUnion or Snap-on Incorporated
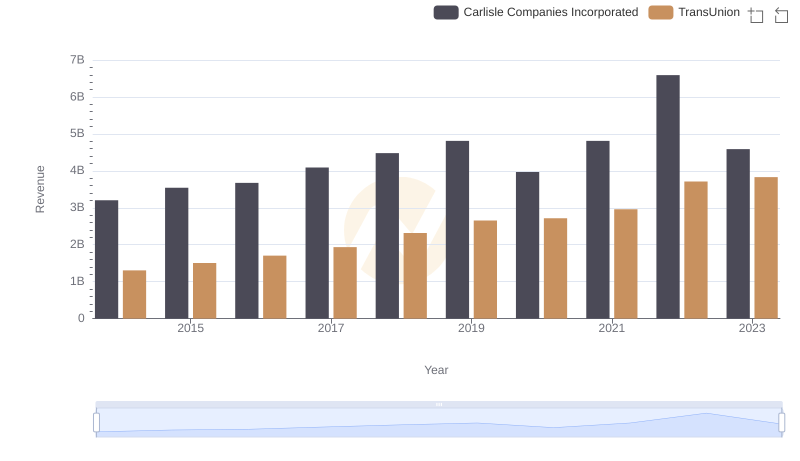
Breaking Down Revenue Trends: TransUnion vs Carlisle Companies Incorporated
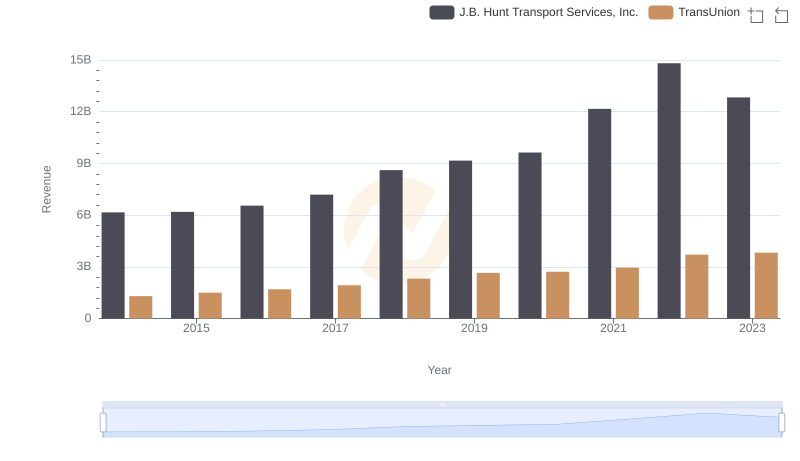
Revenue Insights: TransUnion and J.B. Hunt Transport Services, Inc. Performance Compared
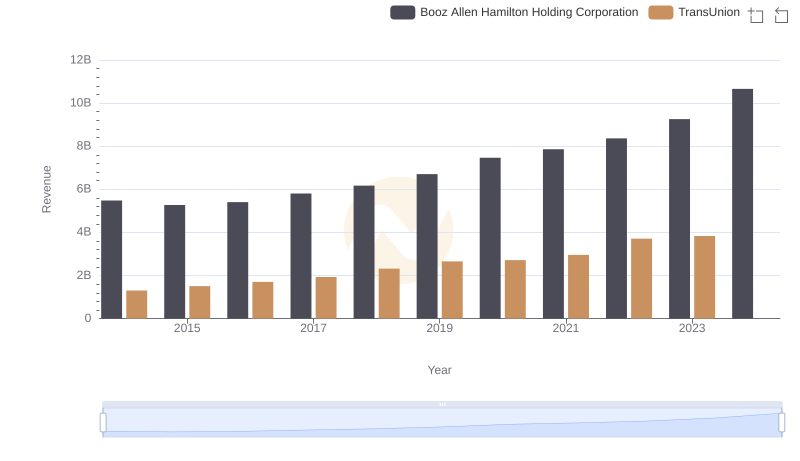
Annual Revenue Comparison: TransUnion vs Booz Allen Hamilton Holding Corporation
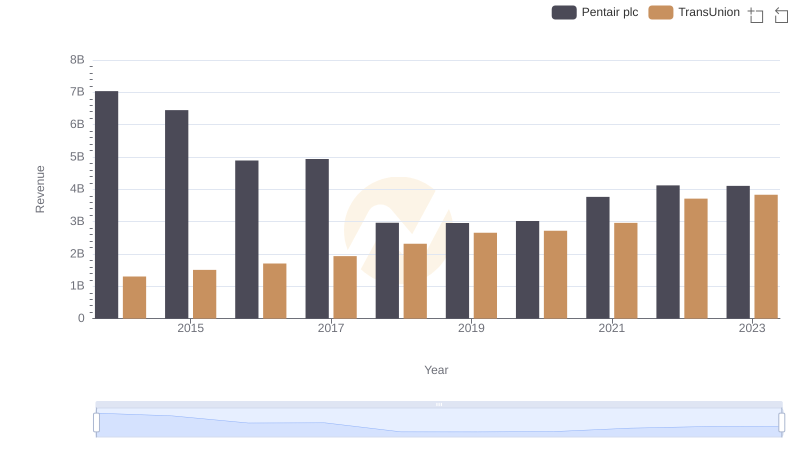
Who Generates More Revenue? TransUnion or Pentair plc
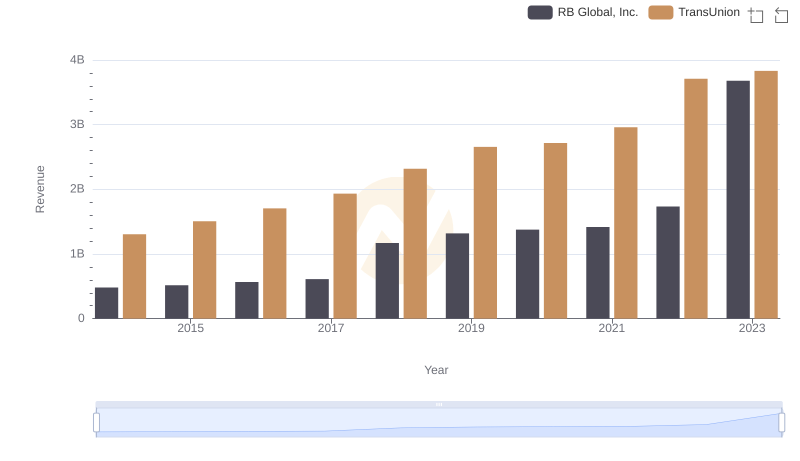
Annual Revenue Comparison: TransUnion vs RB Global, Inc.
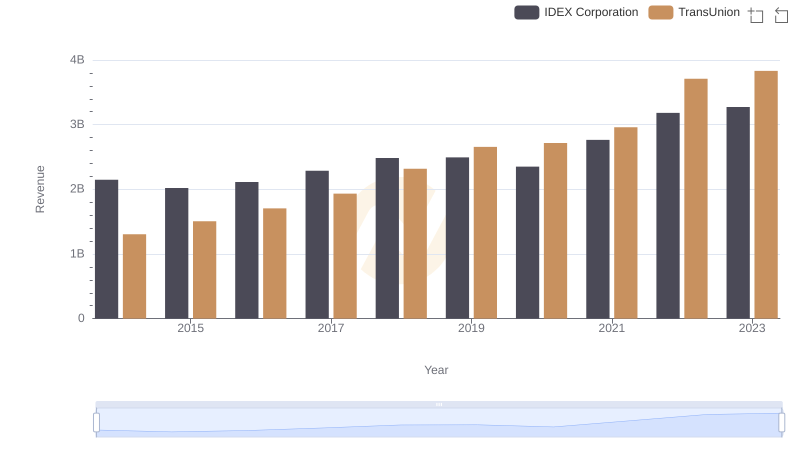
TransUnion vs IDEX Corporation: Annual Revenue Growth Compared

Cost Insights: Breaking Down TransUnion and Jacobs Engineering Group Inc.'s Expenses
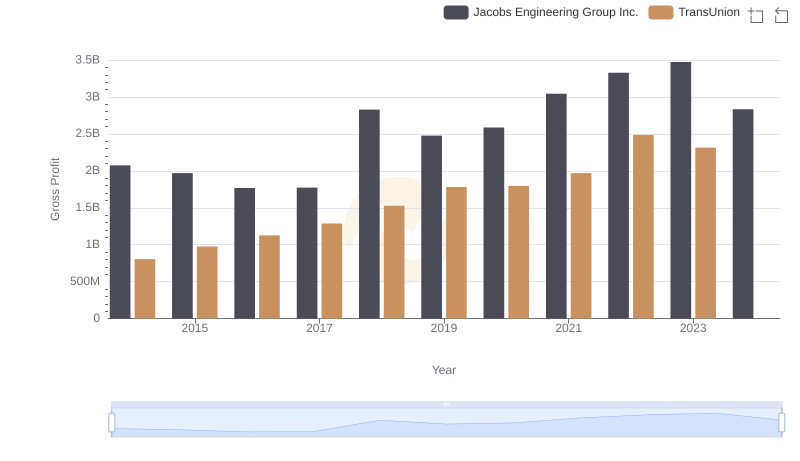
TransUnion and Jacobs Engineering Group Inc.: A Detailed Gross Profit Analysis
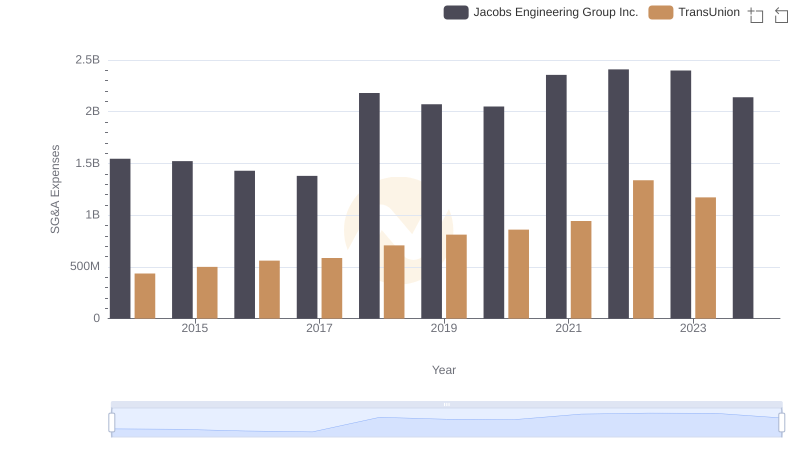
TransUnion vs Jacobs Engineering Group Inc.: SG&A Expense Trends
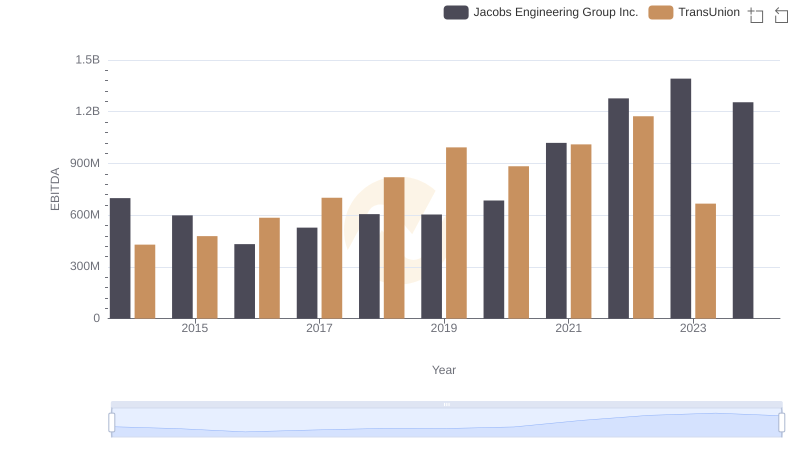
TransUnion vs Jacobs Engineering Group Inc.: In-Depth EBITDA Performance Comparison