| __timestamp | Jacobs Engineering Group Inc. | TransUnion |
|---|---|---|
| Wednesday, January 1, 2014 | 2073784000 | 805600000 |
| Thursday, January 1, 2015 | 1968338000 | 975200000 |
| Friday, January 1, 2016 | 1767831000 | 1125800000 |
| Sunday, January 1, 2017 | 1772252000 | 1288100000 |
| Monday, January 1, 2018 | 2828370000 | 1527100000 |
| Tuesday, January 1, 2019 | 2477028000 | 1782000000 |
| Wednesday, January 1, 2020 | 2586668000 | 1796200000 |
| Friday, January 1, 2021 | 3043772000 | 1968600000 |
| Saturday, January 1, 2022 | 3327040000 | 2487000000 |
| Sunday, January 1, 2023 | 3473315000 | 2313900000 |
| Monday, January 1, 2024 | 2832756000 | 4183800000 |
Cracking the code
In the ever-evolving landscape of corporate finance, understanding gross profit trends is crucial for investors and analysts alike. This analysis delves into the financial trajectories of two industry giants: TransUnion and Jacobs Engineering Group Inc., from 2014 to 2023.
Jacobs Engineering Group Inc. has demonstrated a robust growth trajectory, with its gross profit peaking in 2023 at approximately 3.47 billion, marking a 67% increase from its 2014 figures. In contrast, TransUnion's gross profit saw a steady rise, reaching its zenith in 2022 with a 209% increase from 2014, before experiencing a slight dip in 2023.
While Jacobs Engineering's profits show a consistent upward trend, TransUnion's data for 2024 remains unavailable, leaving room for speculation. This comparative analysis highlights the dynamic nature of financial performance and the importance of strategic planning in maintaining profitability.
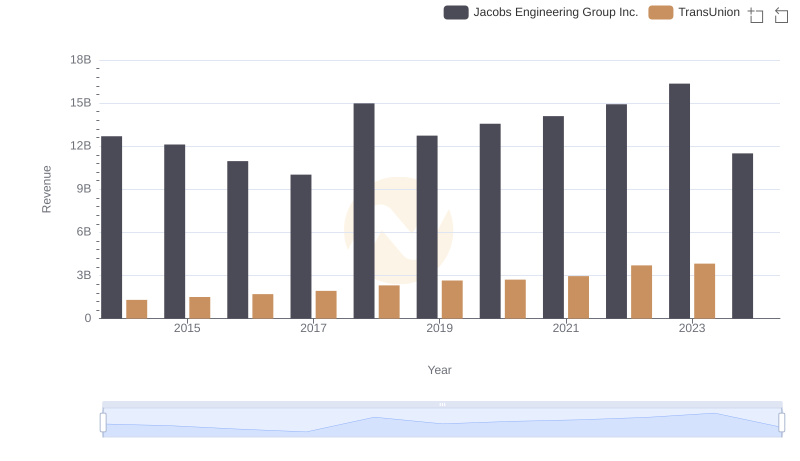
TransUnion vs Jacobs Engineering Group Inc.: Examining Key Revenue Metrics

Cost Insights: Breaking Down TransUnion and Jacobs Engineering Group Inc.'s Expenses
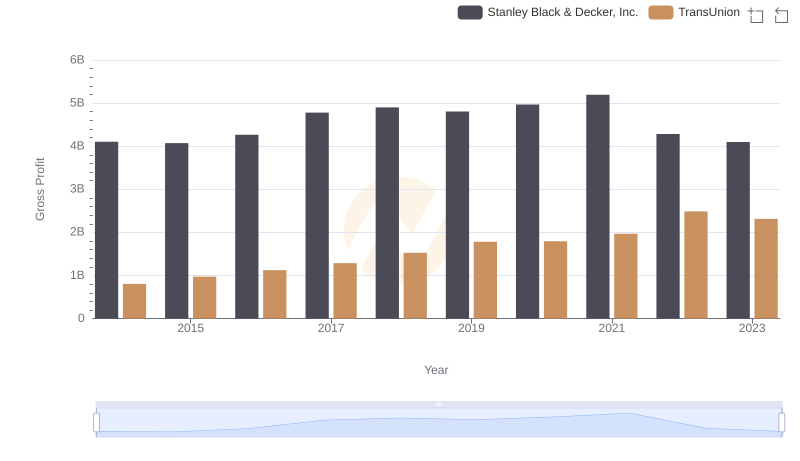
TransUnion vs Stanley Black & Decker, Inc.: A Gross Profit Performance Breakdown
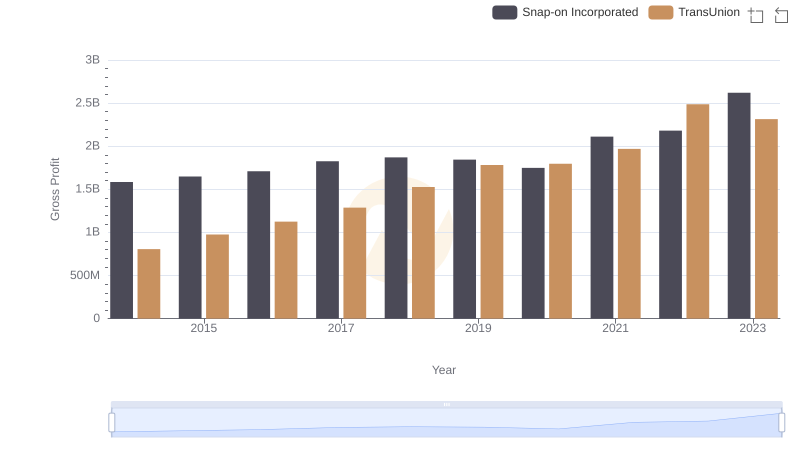
TransUnion and Snap-on Incorporated: A Detailed Gross Profit Analysis
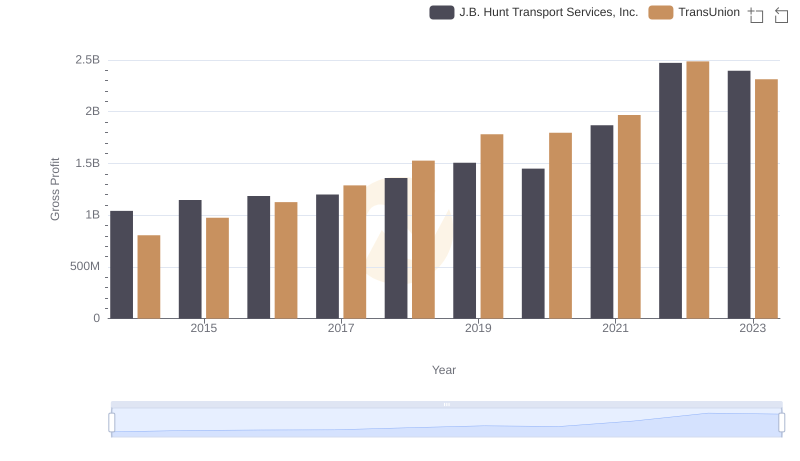
TransUnion and J.B. Hunt Transport Services, Inc.: A Detailed Gross Profit Analysis
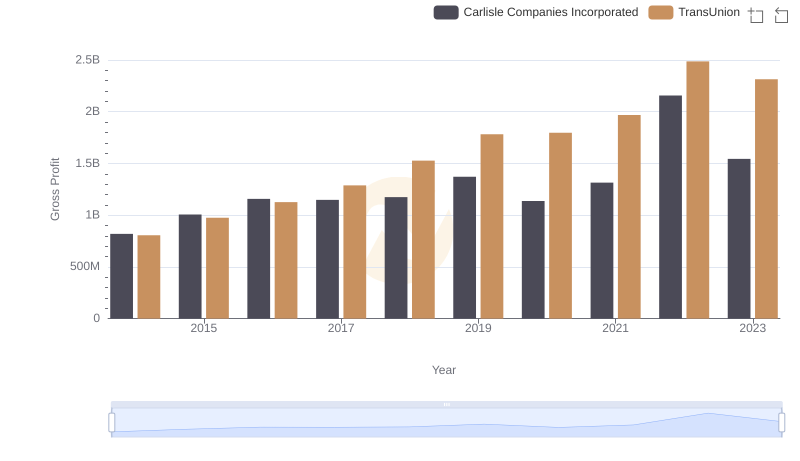
Gross Profit Comparison: TransUnion and Carlisle Companies Incorporated Trends
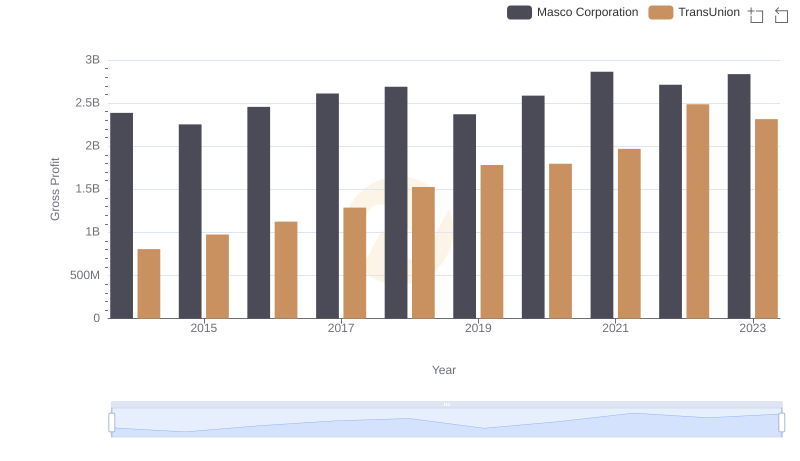
Gross Profit Trends Compared: TransUnion vs Masco Corporation
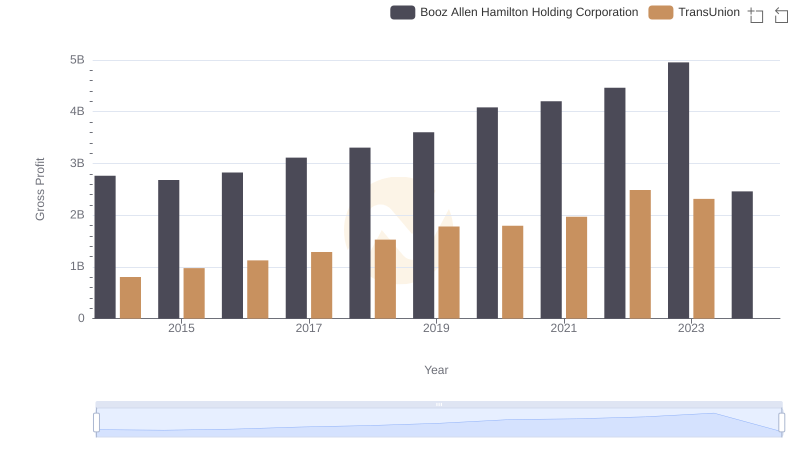
Gross Profit Trends Compared: TransUnion vs Booz Allen Hamilton Holding Corporation
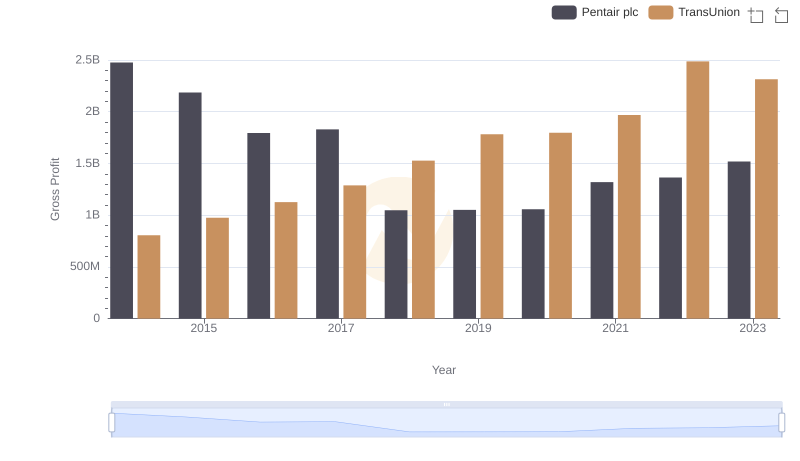
Gross Profit Comparison: TransUnion and Pentair plc Trends
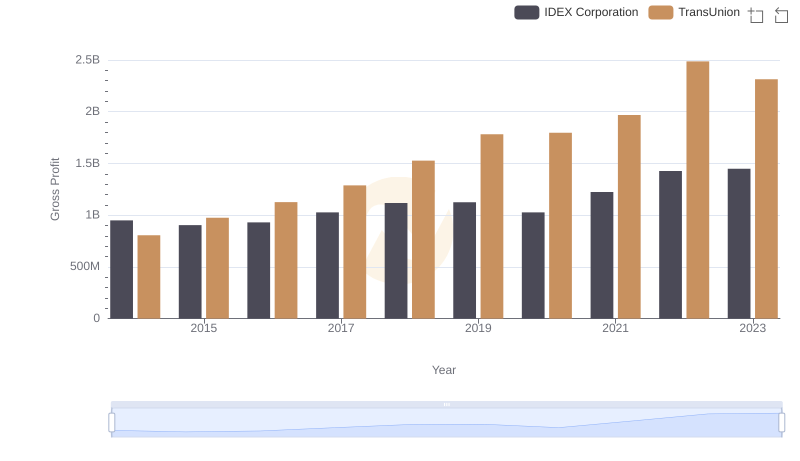
TransUnion vs IDEX Corporation: A Gross Profit Performance Breakdown
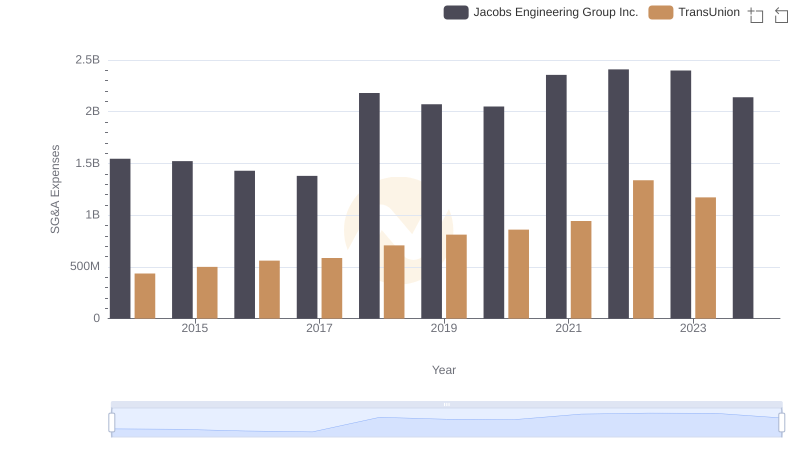
TransUnion vs Jacobs Engineering Group Inc.: SG&A Expense Trends
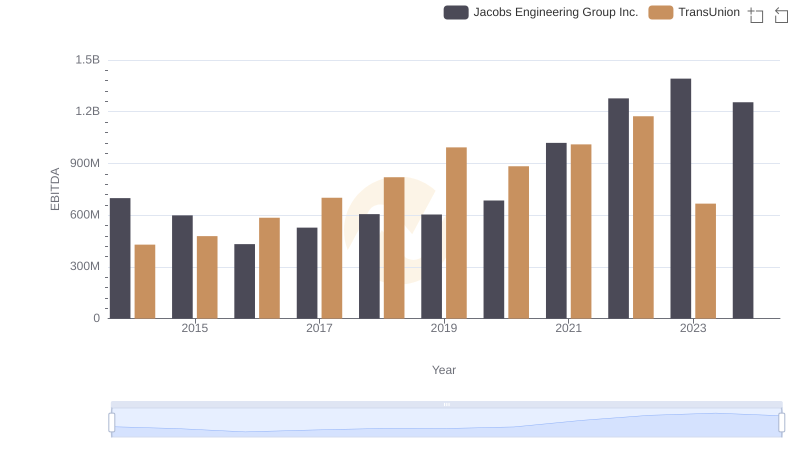
TransUnion vs Jacobs Engineering Group Inc.: In-Depth EBITDA Performance Comparison