| __timestamp | Nokia Oyj | Telefonaktiebolaget LM Ericsson (publ) |
|---|---|---|
| Wednesday, January 1, 2014 | 1634000000 | 27100000000 |
| Thursday, January 1, 2015 | 1651000000 | 29285000000 |
| Friday, January 1, 2016 | 3819000000 | 28866000000 |
| Sunday, January 1, 2017 | 3615000000 | 32676000000 |
| Monday, January 1, 2018 | 3463000000 | 27519000000 |
| Tuesday, January 1, 2019 | 3101000000 | 26137000000 |
| Wednesday, January 1, 2020 | 2898000000 | 26684000000 |
| Friday, January 1, 2021 | 2792000000 | 26957000000 |
| Saturday, January 1, 2022 | 3013000000 | 35692000000 |
| Sunday, January 1, 2023 | 2929000000 | 37682000000 |
Igniting the spark of knowledge
In the competitive landscape of telecommunications, understanding the efficiency of Selling, General, and Administrative (SG&A) expenses is crucial. Over the past decade, Telefonaktiebolaget LM Ericsson (publ) and Nokia Oyj have showcased contrasting trends in their SG&A expenditures.
From 2014 to 2023, Ericsson consistently outspent Nokia, with SG&A expenses peaking at approximately $37.7 billion in 2023. This represents a 39% increase from its 2014 figures, highlighting Ericsson's aggressive investment in administrative and sales functions.
Conversely, Nokia's SG&A expenses remained relatively stable, fluctuating around the $3 billion mark. Despite a peak in 2016, Nokia's expenses in 2023 were only 79% higher than in 2014, indicating a more conservative approach.
These trends reflect differing strategic priorities: Ericsson's expansive approach versus Nokia's steady efficiency. Investors and analysts should consider these insights when evaluating the companies' future growth trajectories.
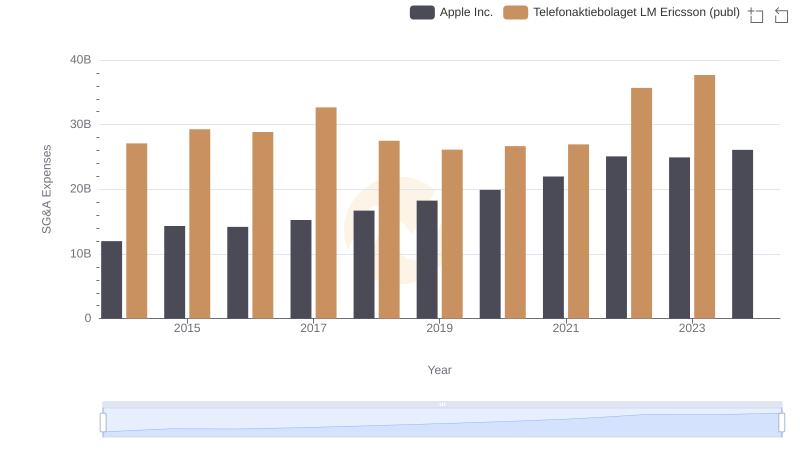
Apple Inc. and Telefonaktiebolaget LM Ericsson (publ): SG&A Spending Patterns Compared
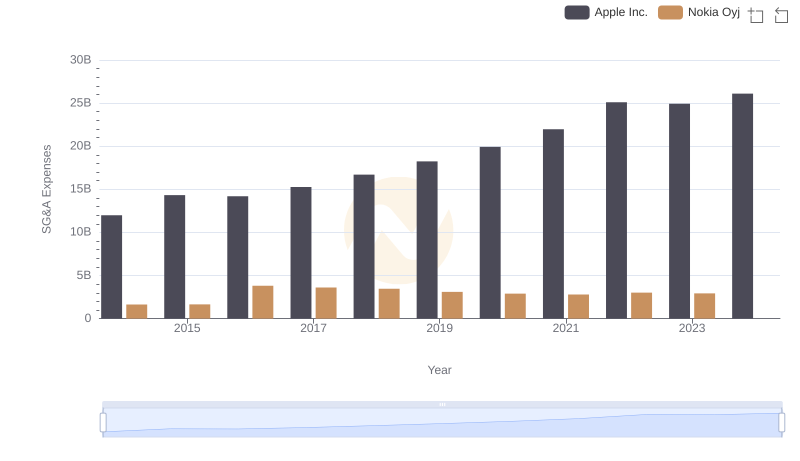
SG&A Efficiency Analysis: Comparing Apple Inc. and Nokia Oyj
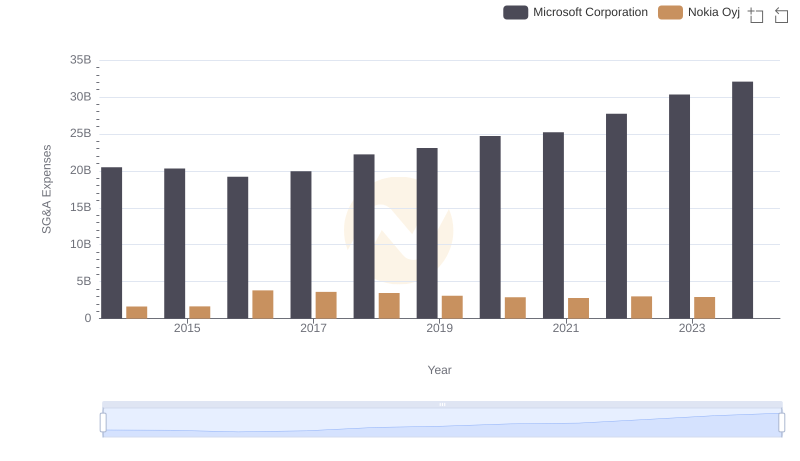
Selling, General, and Administrative Costs: Microsoft Corporation vs Nokia Oyj
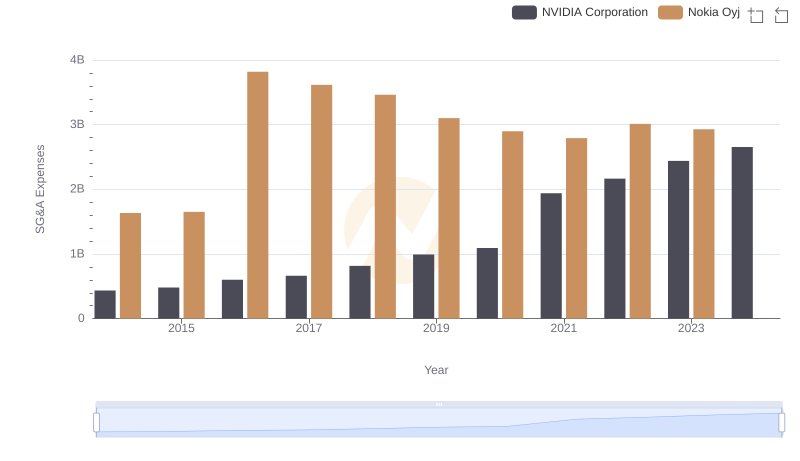
Selling, General, and Administrative Costs: NVIDIA Corporation vs Nokia Oyj
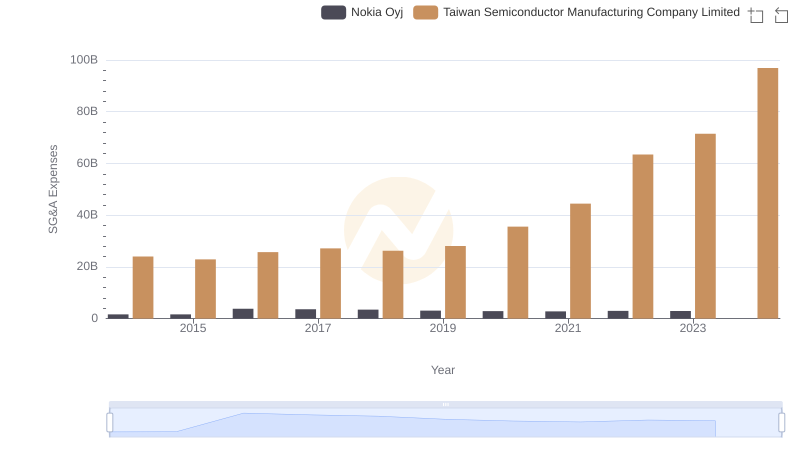
Breaking Down SG&A Expenses: Taiwan Semiconductor Manufacturing Company Limited vs Nokia Oyj

Broadcom Inc. or Telefonaktiebolaget LM Ericsson (publ): Who Manages SG&A Costs Better?
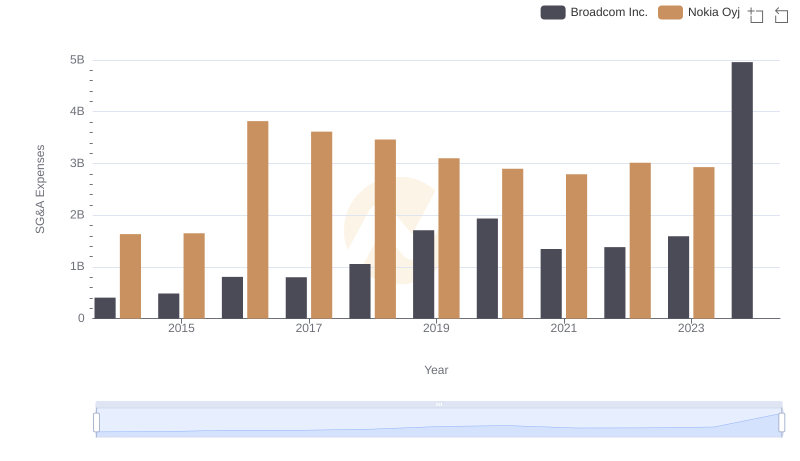
Operational Costs Compared: SG&A Analysis of Broadcom Inc. and Nokia Oyj
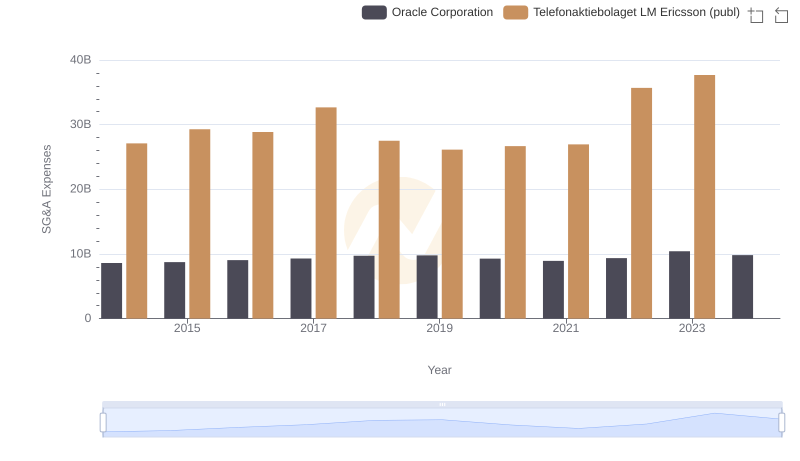
Who Optimizes SG&A Costs Better? Oracle Corporation or Telefonaktiebolaget LM Ericsson (publ)
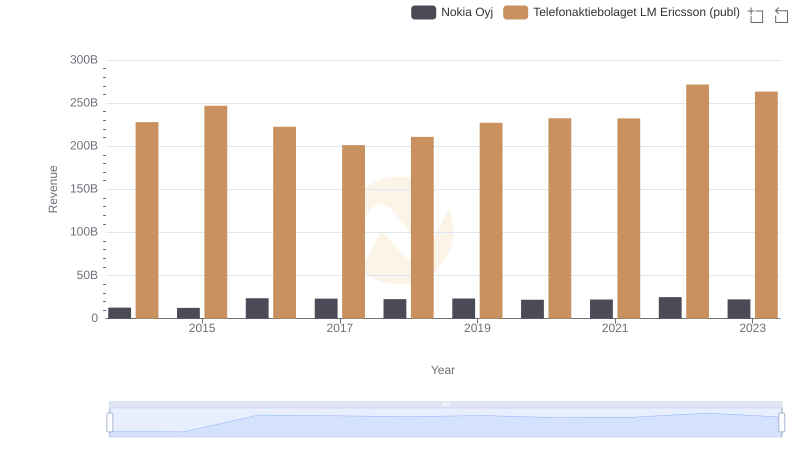
Annual Revenue Comparison: Telefonaktiebolaget LM Ericsson (publ) vs Nokia Oyj
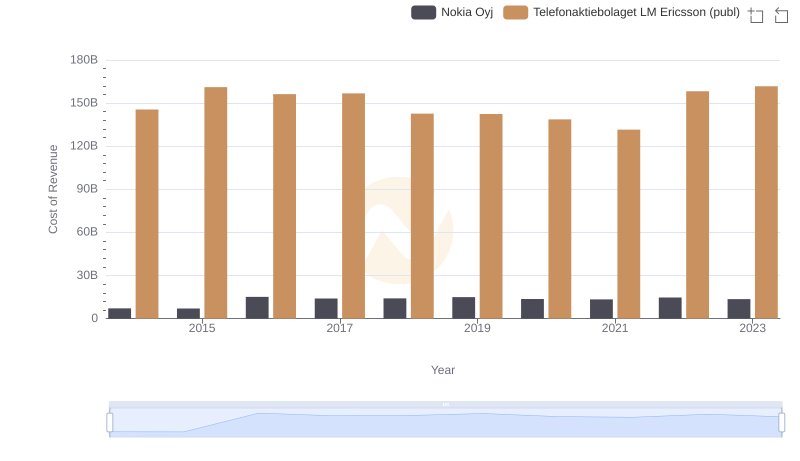
Cost of Revenue Comparison: Telefonaktiebolaget LM Ericsson (publ) vs Nokia Oyj
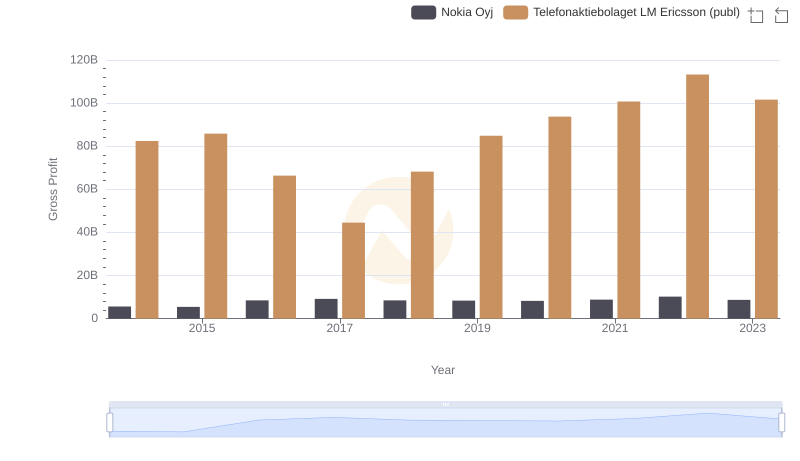
Who Generates Higher Gross Profit? Telefonaktiebolaget LM Ericsson (publ) or Nokia Oyj
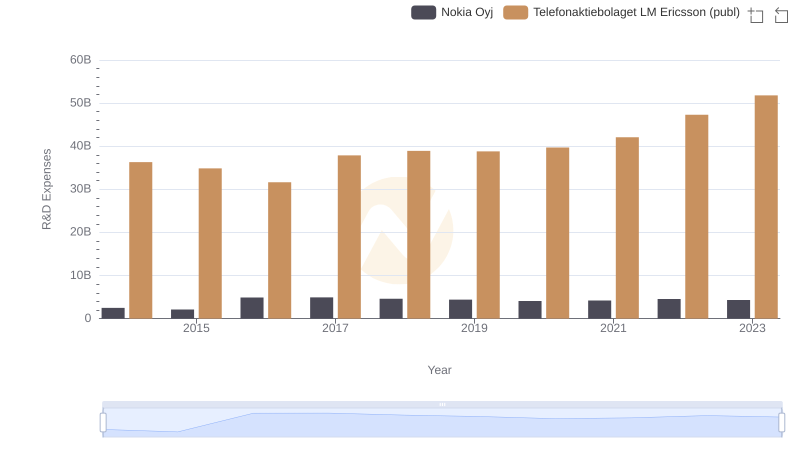
R&D Spending Showdown: Telefonaktiebolaget LM Ericsson (publ) vs Nokia Oyj