| __timestamp | Nokia Oyj | Telefonaktiebolaget LM Ericsson (publ) |
|---|---|---|
| Wednesday, January 1, 2014 | 7094000000 | 145556000000 |
| Thursday, January 1, 2015 | 7045000000 | 161101000000 |
| Friday, January 1, 2016 | 15157000000 | 156243000000 |
| Sunday, January 1, 2017 | 14009000000 | 156758000000 |
| Monday, January 1, 2018 | 14117000000 | 142638000000 |
| Tuesday, January 1, 2019 | 14989000000 | 142392000000 |
| Wednesday, January 1, 2020 | 13653000000 | 138666000000 |
| Friday, January 1, 2021 | 13368000000 | 131565000000 |
| Saturday, January 1, 2022 | 14689000000 | 158251000000 |
| Sunday, January 1, 2023 | 13571000000 | 161749000000 |
Unleashing the power of data
In the ever-evolving telecommunications industry, the cost of revenue is a critical metric that reflects a company's efficiency and market strategy. Over the past decade, from 2014 to 2023, Telefonaktiebolaget LM Ericsson and Nokia Oyj have showcased contrasting trends in their cost of revenue. Ericsson's cost of revenue has consistently been higher, peaking at approximately 161.7 billion in 2023, marking a 10% increase from 2014. In contrast, Nokia's cost of revenue has been more volatile, with a notable 115% increase from 2014 to 2016, followed by a stabilization around 13.5 billion in recent years. This divergence highlights Ericsson's expansive operational scale compared to Nokia's more fluctuating cost structure. As these giants continue to innovate, understanding their financial strategies offers valuable insights into their competitive positioning in the global market.
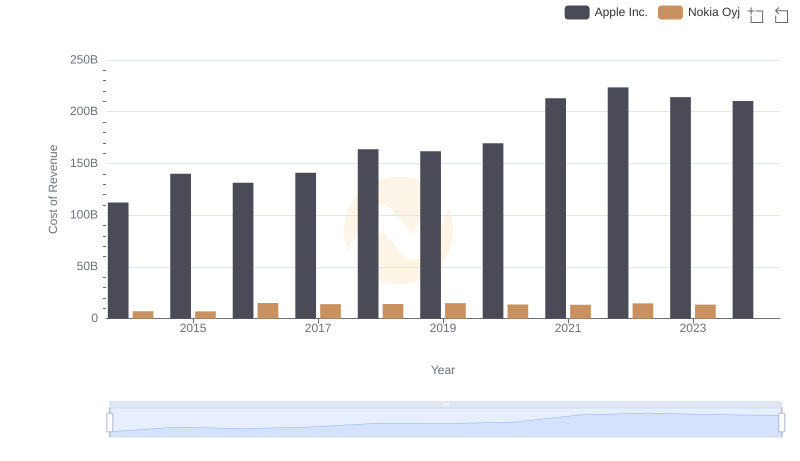
Cost of Revenue: Key Insights for Apple Inc. and Nokia Oyj
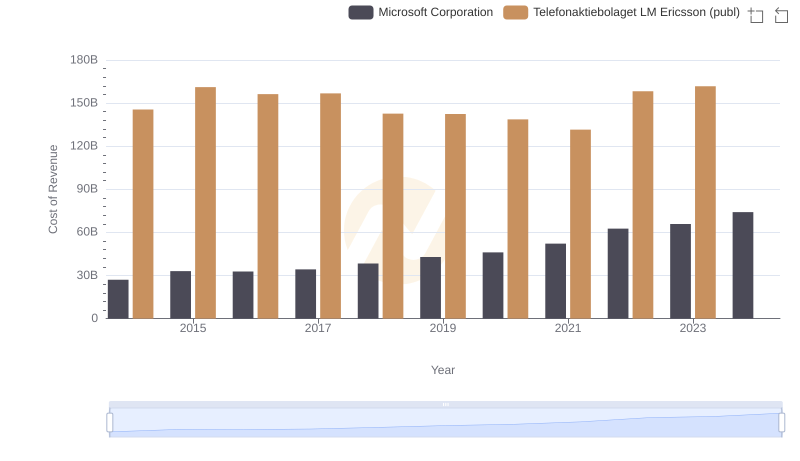
Cost Insights: Breaking Down Microsoft Corporation and Telefonaktiebolaget LM Ericsson (publ)'s Expenses
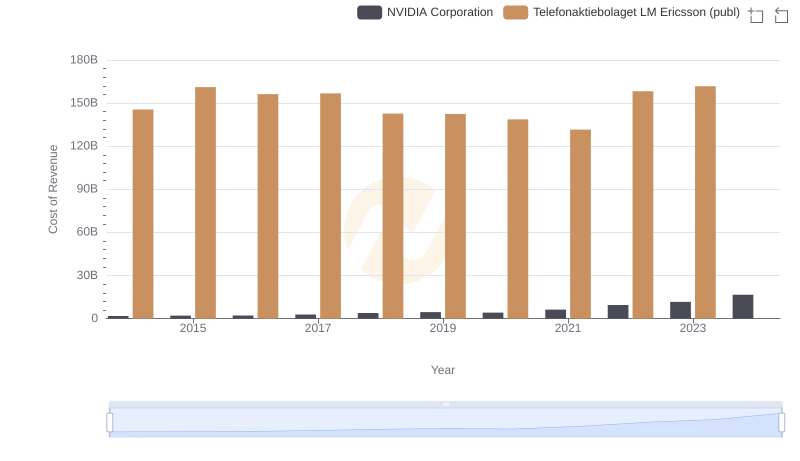
Cost of Revenue Trends: NVIDIA Corporation vs Telefonaktiebolaget LM Ericsson (publ)
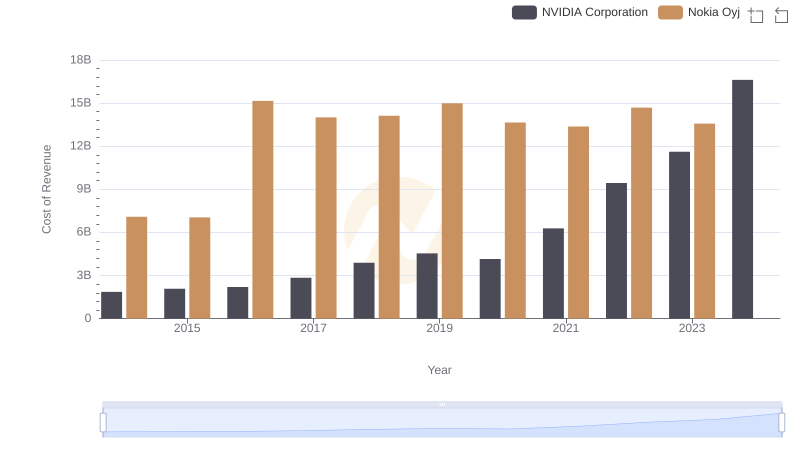
NVIDIA Corporation vs Nokia Oyj: Efficiency in Cost of Revenue Explored
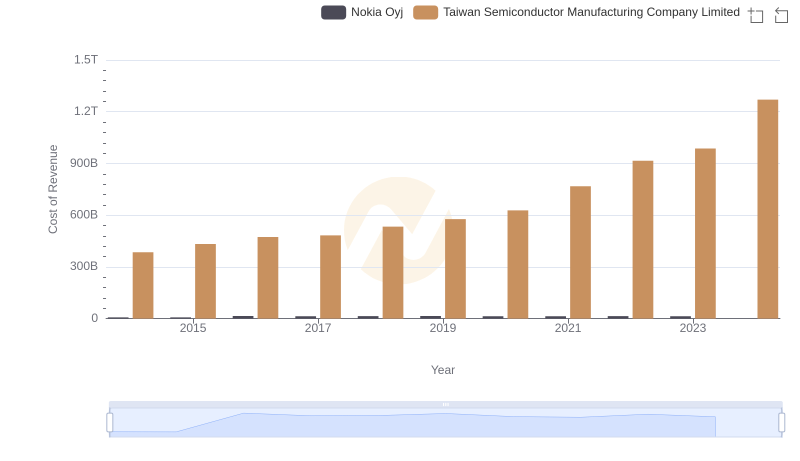
Analyzing Cost of Revenue: Taiwan Semiconductor Manufacturing Company Limited and Nokia Oyj
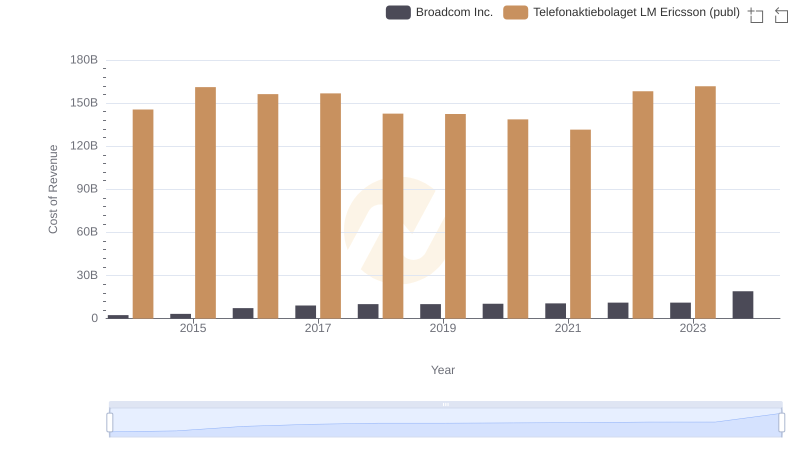
Cost of Revenue: Key Insights for Broadcom Inc. and Telefonaktiebolaget LM Ericsson (publ)
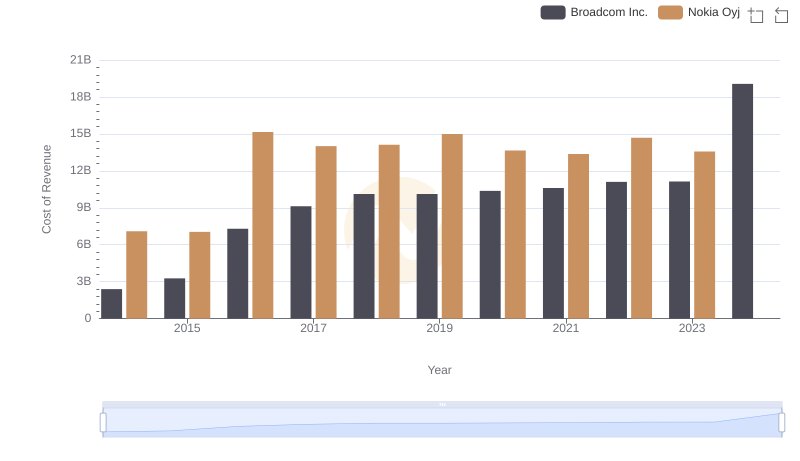
Cost of Revenue: Key Insights for Broadcom Inc. and Nokia Oyj
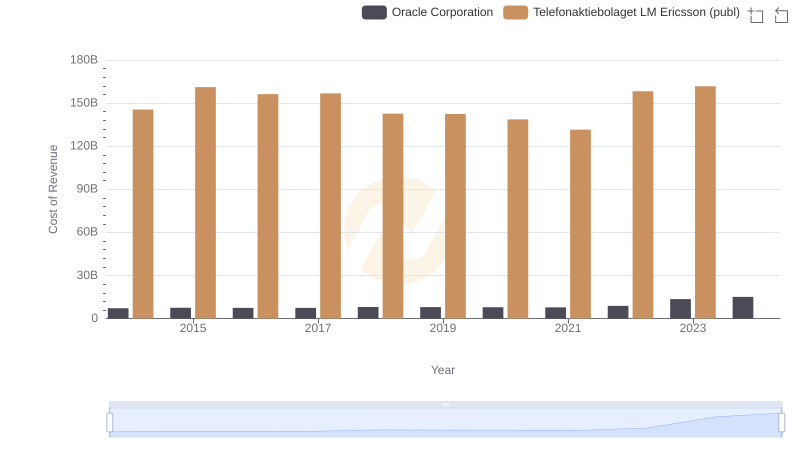
Cost of Revenue: Key Insights for Oracle Corporation and Telefonaktiebolaget LM Ericsson (publ)
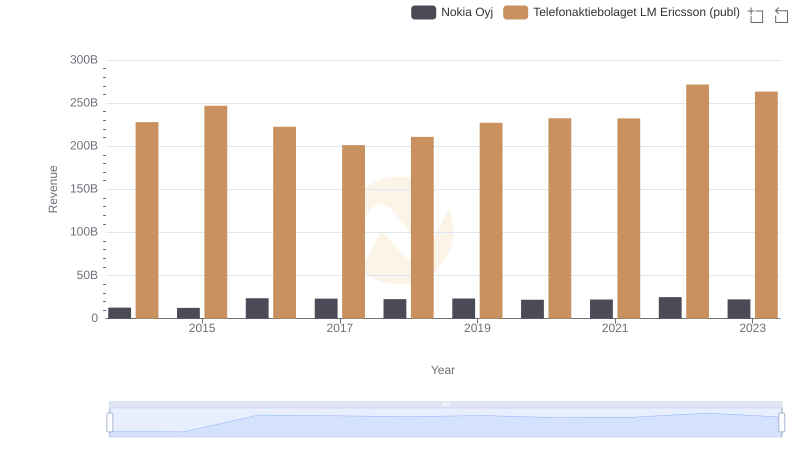
Annual Revenue Comparison: Telefonaktiebolaget LM Ericsson (publ) vs Nokia Oyj
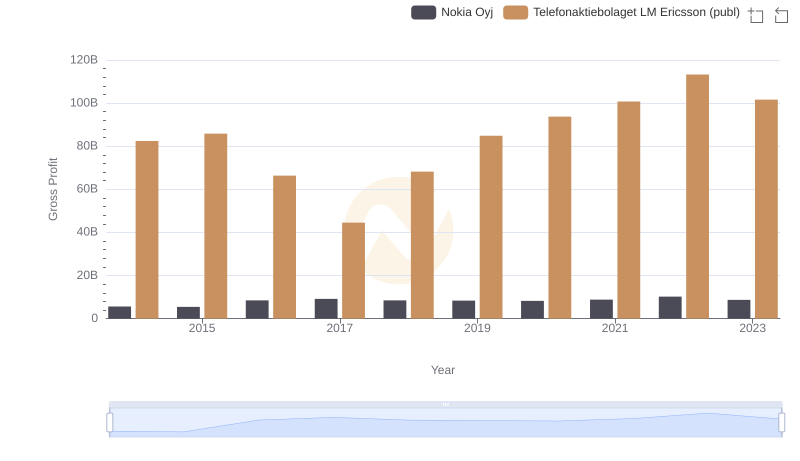
Who Generates Higher Gross Profit? Telefonaktiebolaget LM Ericsson (publ) or Nokia Oyj
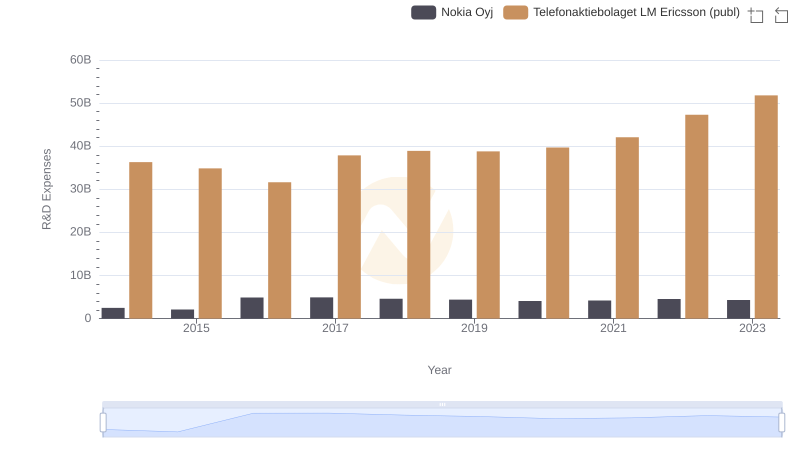
R&D Spending Showdown: Telefonaktiebolaget LM Ericsson (publ) vs Nokia Oyj
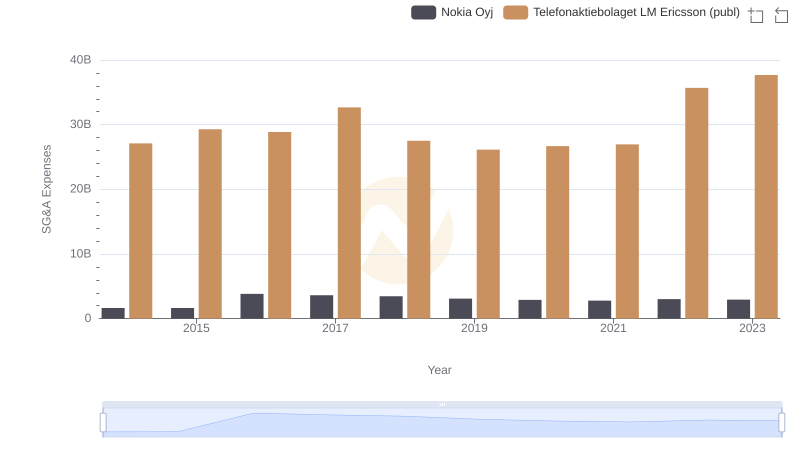
SG&A Efficiency Analysis: Comparing Telefonaktiebolaget LM Ericsson (publ) and Nokia Oyj