| __timestamp | HEICO Corporation | RTX Corporation |
|---|---|---|
| Wednesday, January 1, 2014 | 194924000 | 6500000000 |
| Thursday, January 1, 2015 | 204523000 | 5886000000 |
| Friday, January 1, 2016 | 250147000 | 6060000000 |
| Sunday, January 1, 2017 | 268067000 | 6183000000 |
| Monday, January 1, 2018 | 314470000 | 7066000000 |
| Tuesday, January 1, 2019 | 356743000 | 8521000000 |
| Wednesday, January 1, 2020 | 305479000 | 5540000000 |
| Friday, January 1, 2021 | 334523000 | 5224000000 |
| Saturday, January 1, 2022 | 365915000 | 5663000000 |
| Sunday, January 1, 2023 | 516292000 | 4029000000 |
| Monday, January 1, 2024 | 677271000 | 5806000000 |
Unleashing the power of data
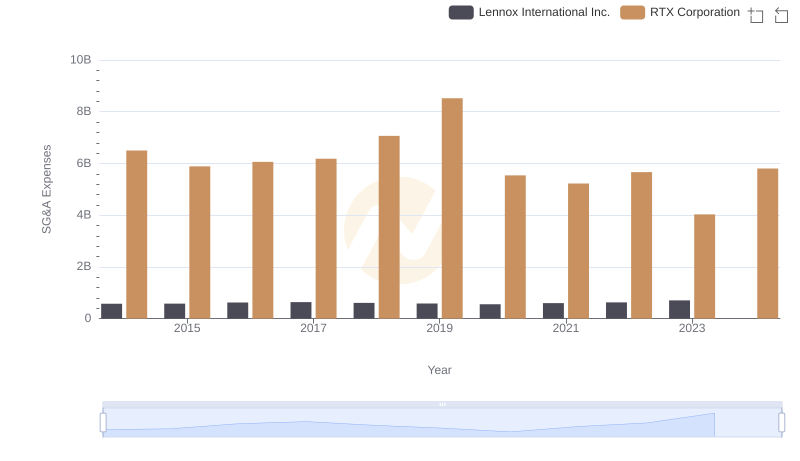
In the competitive landscape of aerospace and defense, understanding the efficiency of Selling, General, and Administrative (SG&A) expenses is crucial. Over the past decade, RTX Corporation and HEICO Corporation have showcased contrasting trends in their SG&A expenditures.
From 2014 to 2024, HEICO Corporation's SG&A expenses have surged by approximately 247%, reflecting a strategic expansion and investment in operational capabilities. In contrast, RTX Corporation's SG&A expenses have seen a more modest fluctuation, peaking in 2019 and then experiencing a decline, with a notable 29% drop by 2023.
These trends highlight HEICO's aggressive growth strategy, while RTX's recent reductions may indicate a focus on cost optimization. Investors and industry analysts should consider these dynamics when evaluating the operational efficiency and strategic direction of these industry giants.
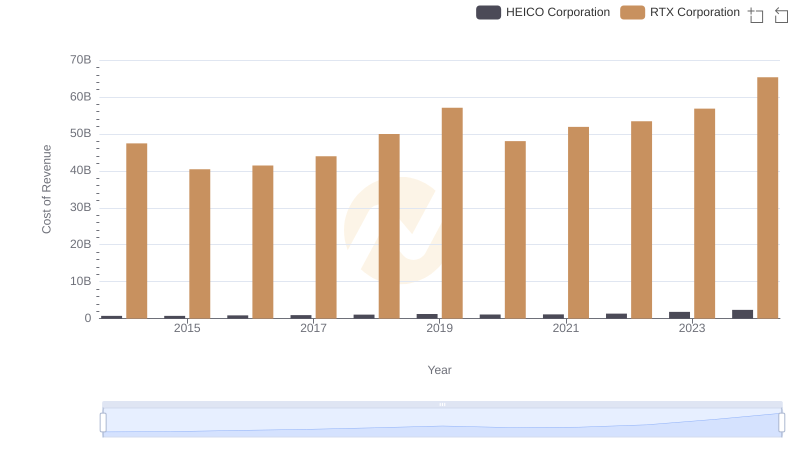
Comparing Cost of Revenue Efficiency: RTX Corporation vs HEICO Corporation
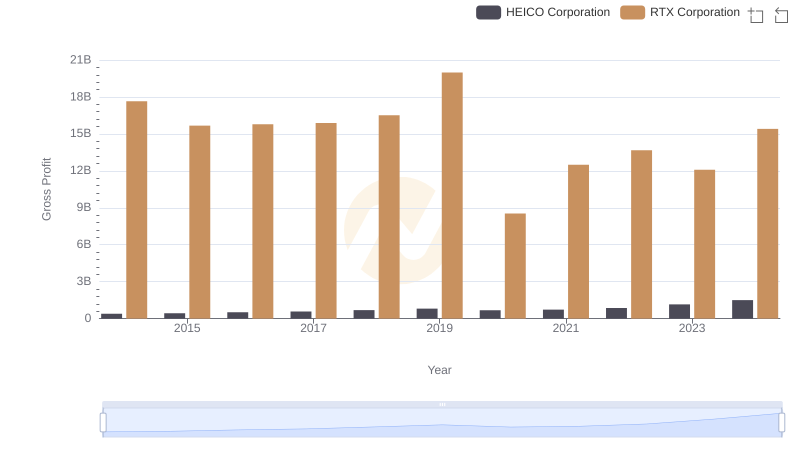
Who Generates Higher Gross Profit? RTX Corporation or HEICO Corporation
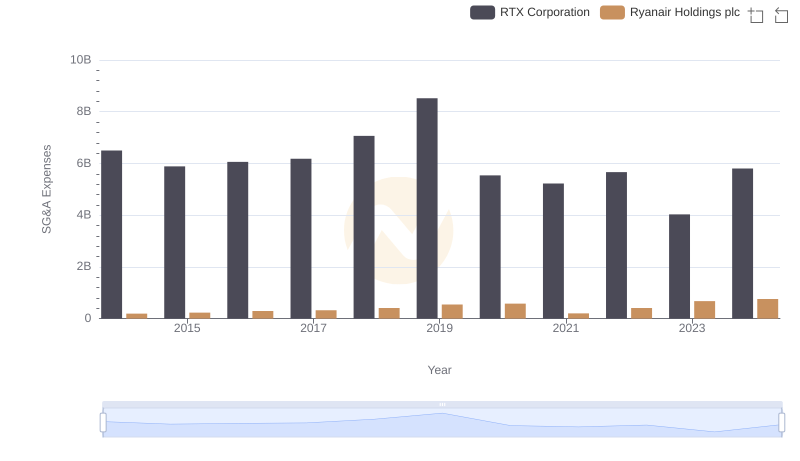
Comparing SG&A Expenses: RTX Corporation vs Ryanair Holdings plc Trends and Insights
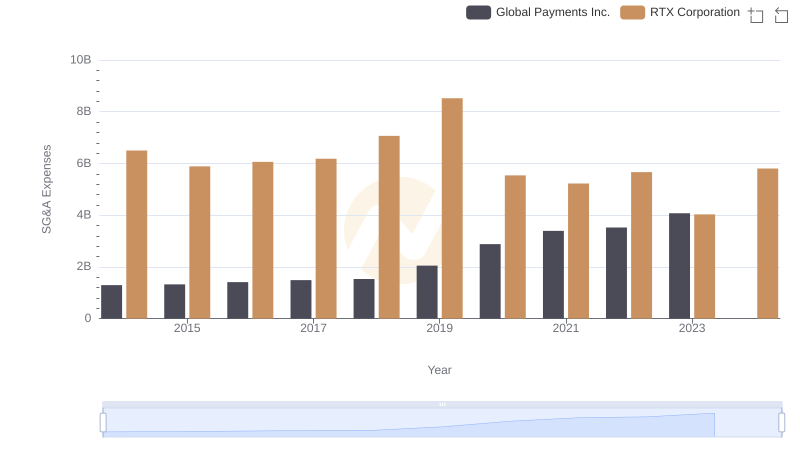
Cost Management Insights: SG&A Expenses for RTX Corporation and Global Payments Inc.
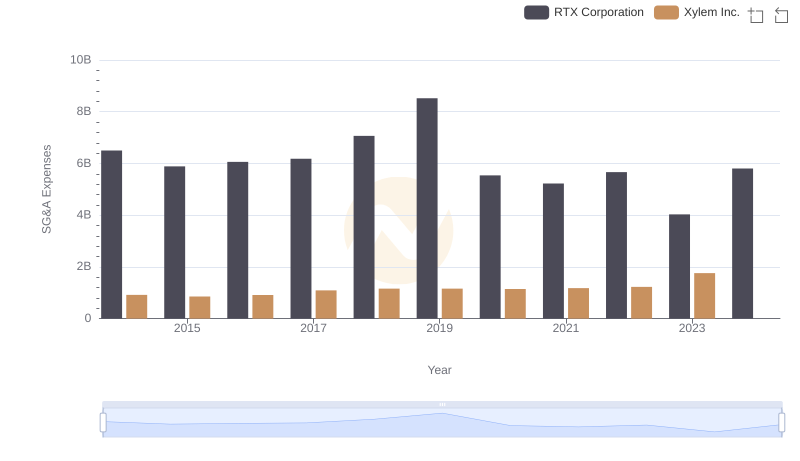
Selling, General, and Administrative Costs: RTX Corporation vs Xylem Inc.
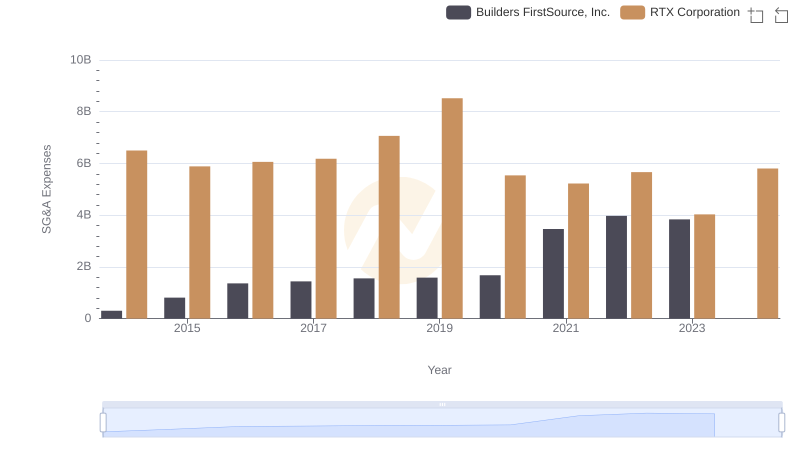
SG&A Efficiency Analysis: Comparing RTX Corporation and Builders FirstSource, Inc.
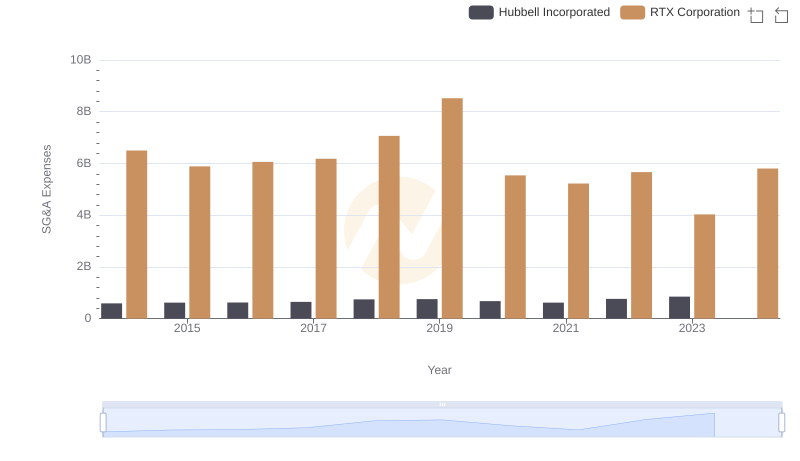
Breaking Down SG&A Expenses: RTX Corporation vs Hubbell Incorporated
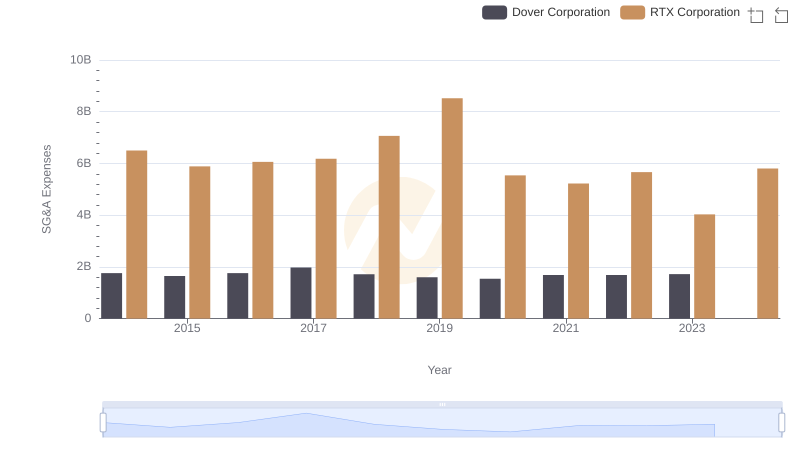
RTX Corporation or Dover Corporation: Who Manages SG&A Costs Better?
Who Optimizes SG&A Costs Better? RTX Corporation or Lennox International Inc.
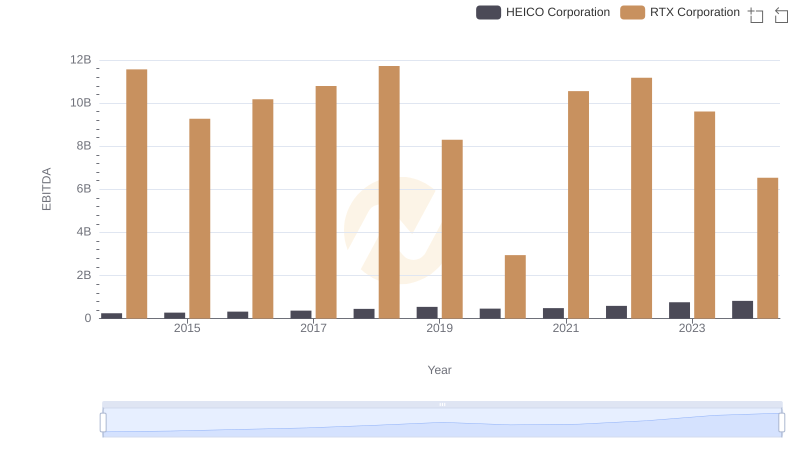
Professional EBITDA Benchmarking: RTX Corporation vs HEICO Corporation