| __timestamp | HEICO Corporation | RTX Corporation |
|---|---|---|
| Wednesday, January 1, 2014 | 251213000 | 11567000000 |
| Thursday, January 1, 2015 | 276790000 | 9275000000 |
| Friday, January 1, 2016 | 325022000 | 10177000000 |
| Sunday, January 1, 2017 | 372581000 | 10792000000 |
| Monday, January 1, 2018 | 452287000 | 11721000000 |
| Tuesday, January 1, 2019 | 542136000 | 8298000000 |
| Wednesday, January 1, 2020 | 465714000 | 2947000000 |
| Friday, January 1, 2021 | 486243000 | 10556000000 |
| Saturday, January 1, 2022 | 592709000 | 11174000000 |
| Sunday, January 1, 2023 | 756767000 | 9611000000 |
| Monday, January 1, 2024 | 824455000 | 12528000000 |
In pursuit of knowledge
In the competitive landscape of aerospace and defense, RTX Corporation and HEICO Corporation have showcased distinct financial trajectories over the past decade. From 2014 to 2024, RTX Corporation's EBITDA fluctuated significantly, peaking in 2014 with a robust performance and experiencing a notable dip in 2020, reflecting a challenging period. However, by 2022, RTX rebounded, achieving a 280% increase from its 2020 low.
Conversely, HEICO Corporation demonstrated a steady upward trend, with its EBITDA growing by approximately 228% from 2014 to 2024. This consistent growth underscores HEICO's strategic resilience and adaptability in a dynamic market.
The contrasting paths of these two industry leaders highlight the diverse strategies and market conditions influencing their financial outcomes. As the aerospace sector evolves, these insights provide valuable benchmarks for stakeholders and investors seeking to navigate this complex industry.
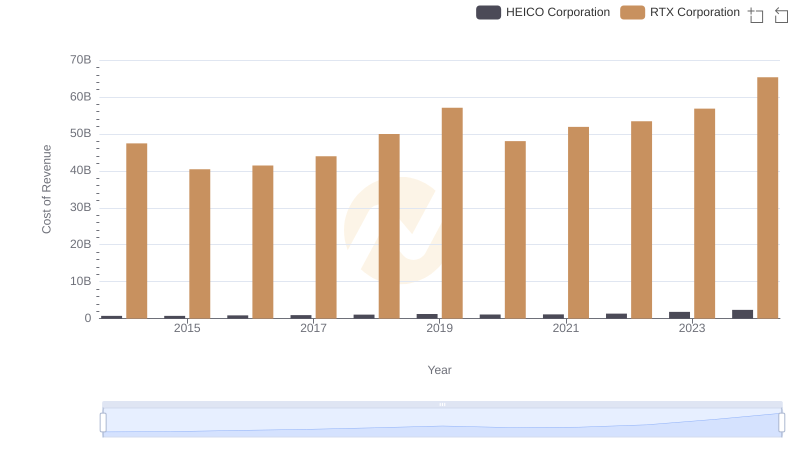
Comparing Cost of Revenue Efficiency: RTX Corporation vs HEICO Corporation
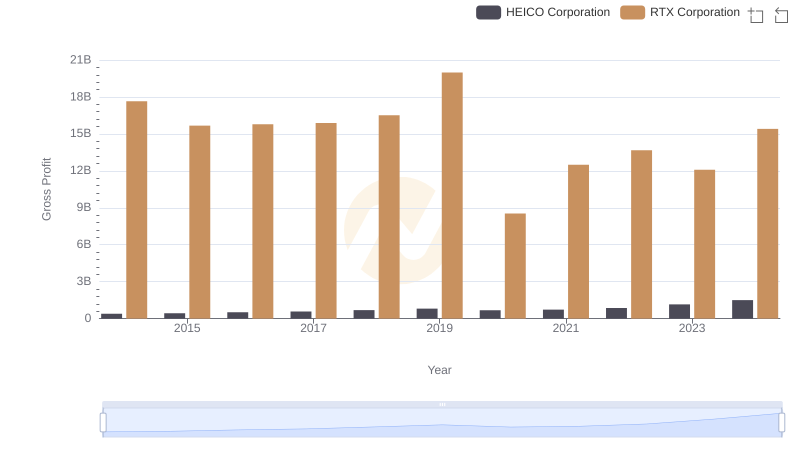
Who Generates Higher Gross Profit? RTX Corporation or HEICO Corporation
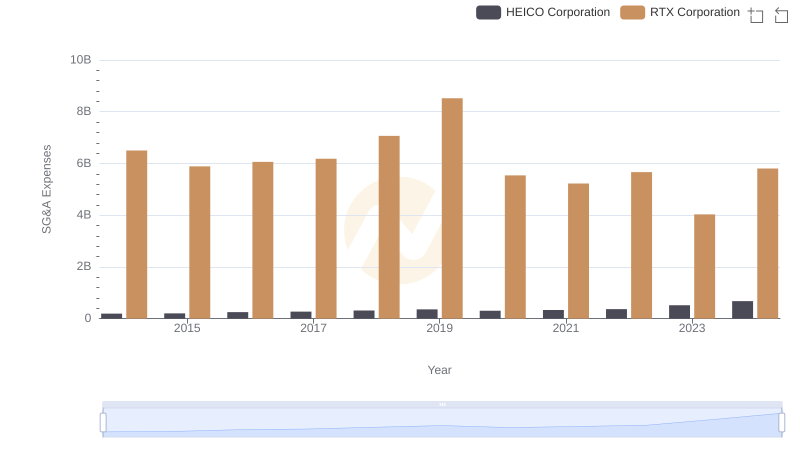
SG&A Efficiency Analysis: Comparing RTX Corporation and HEICO Corporation
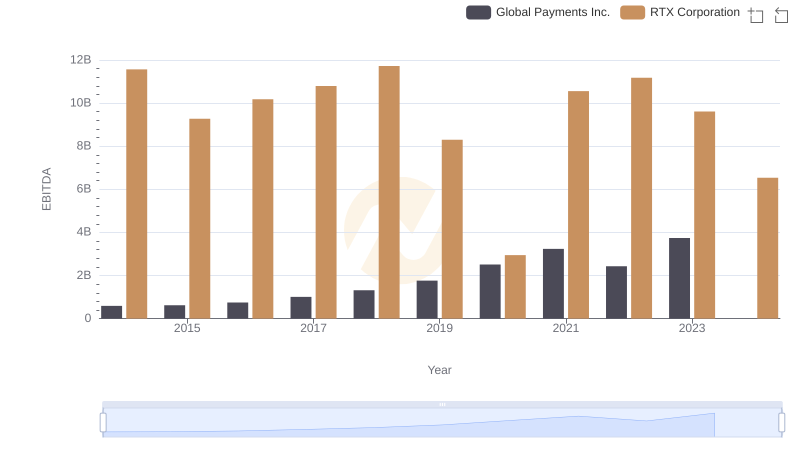
RTX Corporation and Global Payments Inc.: A Detailed Examination of EBITDA Performance
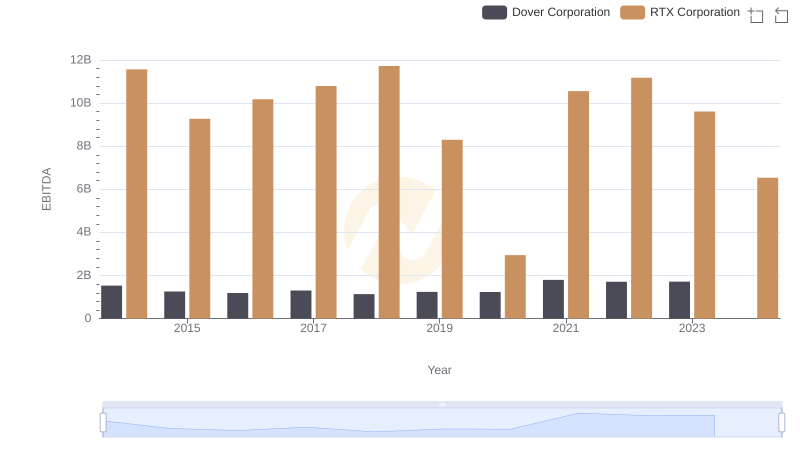
Comparative EBITDA Analysis: RTX Corporation vs Dover Corporation
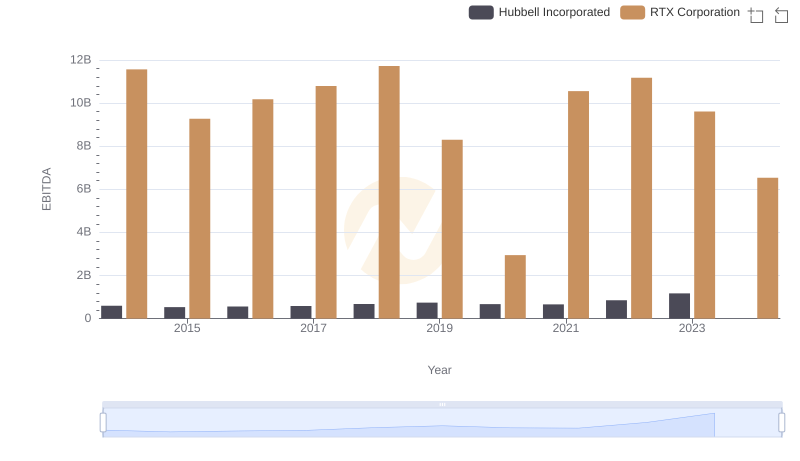
EBITDA Analysis: Evaluating RTX Corporation Against Hubbell Incorporated

Comparative EBITDA Analysis: RTX Corporation vs Builders FirstSource, Inc.
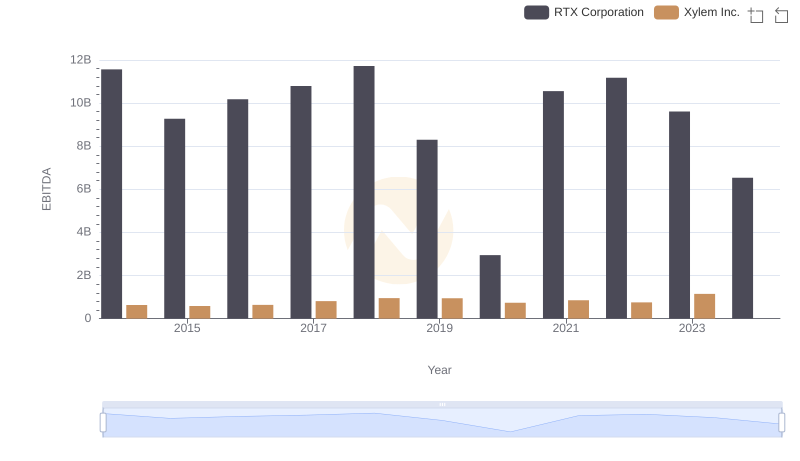
A Professional Review of EBITDA: RTX Corporation Compared to Xylem Inc.

EBITDA Metrics Evaluated: RTX Corporation vs EMCOR Group, Inc.
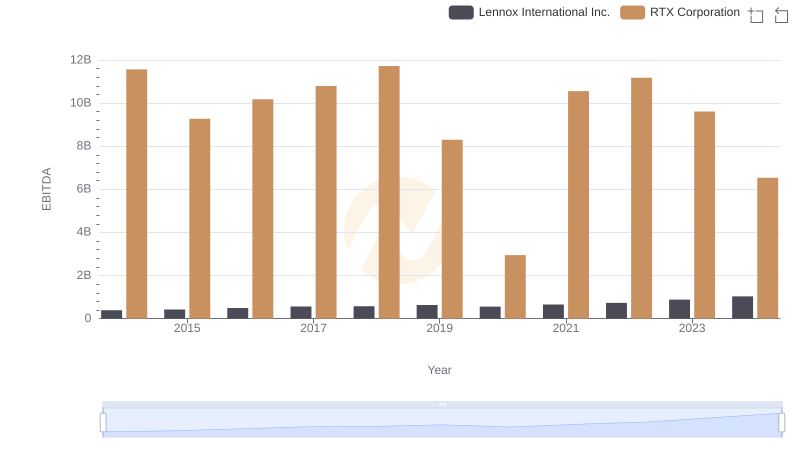
Comprehensive EBITDA Comparison: RTX Corporation vs Lennox International Inc.

Comprehensive EBITDA Comparison: RTX Corporation vs Watsco, Inc.