| __timestamp | Atlassian Corporation | SAP SE |
|---|---|---|
| Wednesday, January 1, 2014 | 75782000 | 5195000000 |
| Thursday, January 1, 2015 | 125319000 | 6449000000 |
| Friday, January 1, 2016 | 178849000 | 7299000000 |
| Sunday, January 1, 2017 | 253693000 | 7999000000 |
| Monday, January 1, 2018 | 339232000 | 7879000000 |
| Tuesday, January 1, 2019 | 484070000 | 9318000000 |
| Wednesday, January 1, 2020 | 568092000 | 8461000000 |
| Friday, January 1, 2021 | 688151000 | 9936000000 |
| Saturday, January 1, 2022 | 1046064000 | 11015000000 |
| Sunday, January 1, 2023 | 1376223000 | 10192000000 |
| Monday, January 1, 2024 | 1488074000 | 10254000000 |
Unleashing insights
In the ever-evolving landscape of global business, understanding the financial strategies of leading companies is crucial. This analysis delves into the Selling, General, and Administrative (SG&A) expenses of two tech giants: SAP SE and Atlassian Corporation, from 2014 to 2023.
Over the past decade, SAP SE has consistently maintained higher SG&A expenses compared to Atlassian, reflecting its expansive global operations. In 2022, SAP's SG&A expenses peaked at approximately €11 billion, marking a 112% increase from 2014. Meanwhile, Atlassian's expenses grew exponentially, surging by over 1,860% from 2014 to 2023, reaching nearly €1.5 billion.
This trend highlights Atlassian's aggressive growth strategy, while SAP's stable expenses suggest a focus on sustaining its market leadership. Notably, 2024 data for SAP is missing, indicating potential shifts in financial strategy. Understanding these trends offers valuable insights into the strategic priorities of these industry leaders.
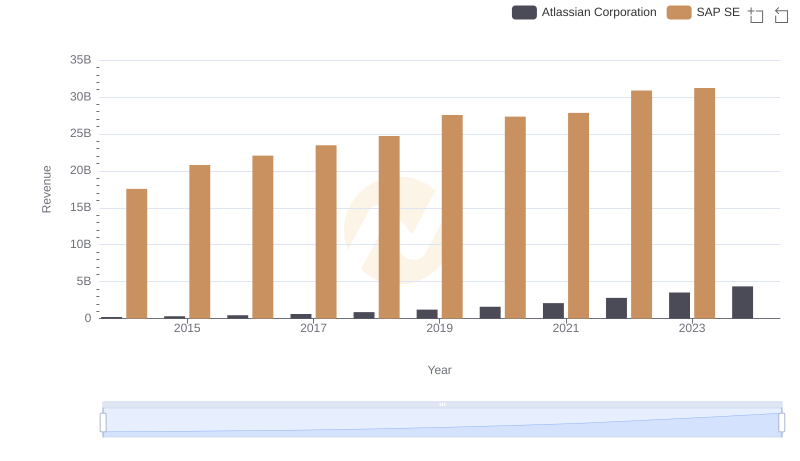
SAP SE vs Atlassian Corporation: Examining Key Revenue Metrics
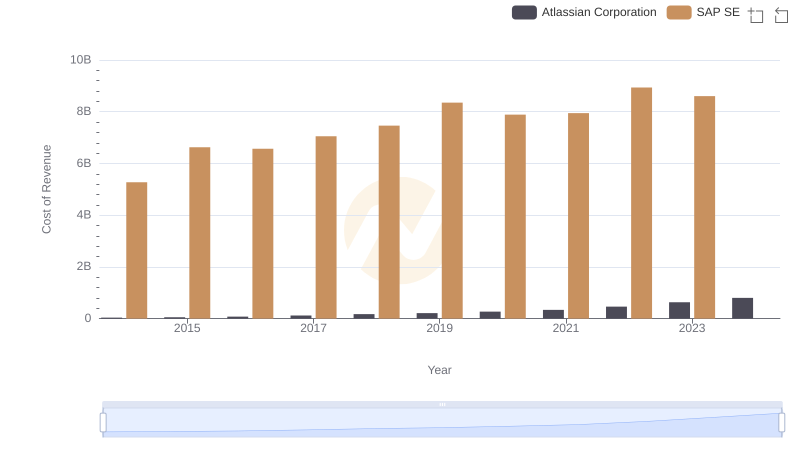
Analyzing Cost of Revenue: SAP SE and Atlassian Corporation
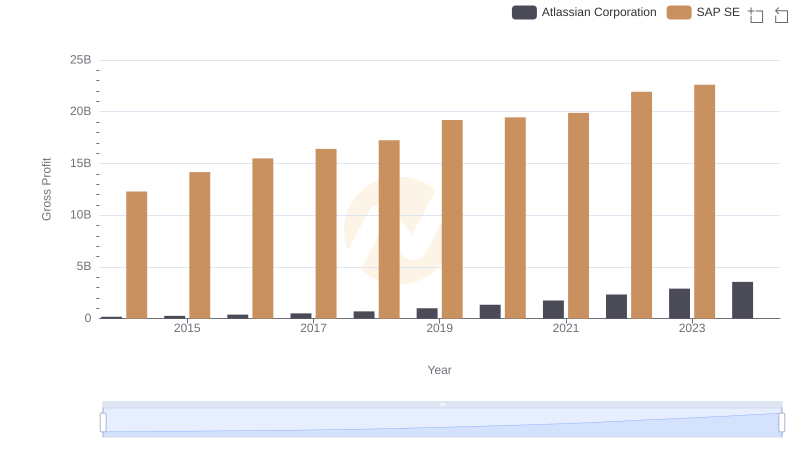
Gross Profit Comparison: SAP SE and Atlassian Corporation Trends
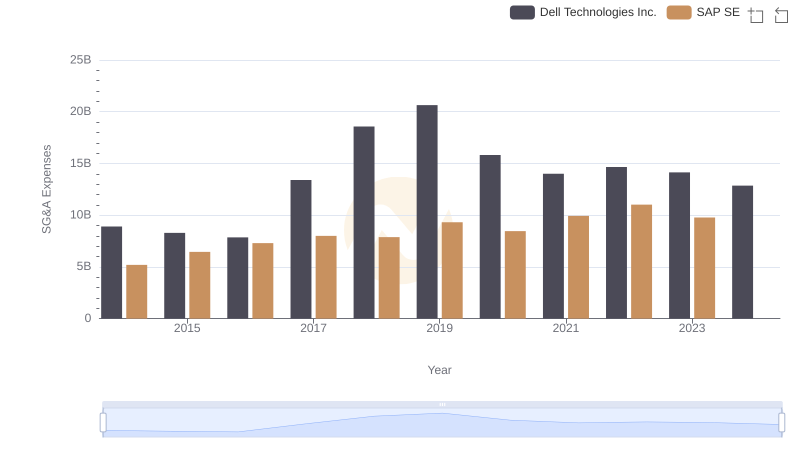
Who Optimizes SG&A Costs Better? SAP SE or Dell Technologies Inc.
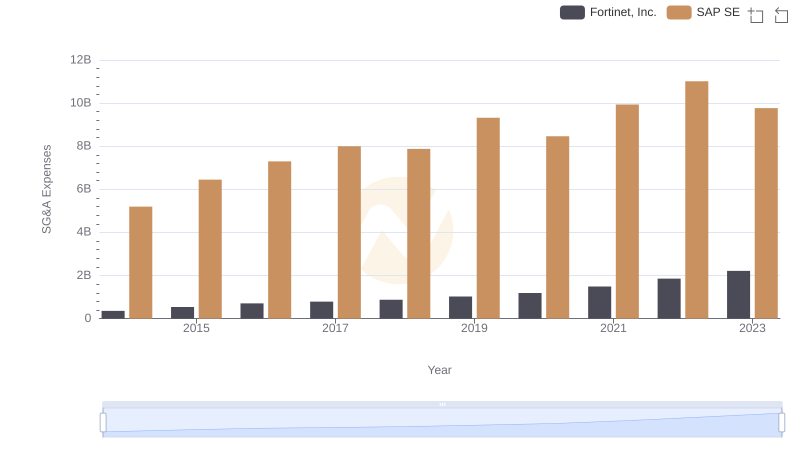
SG&A Efficiency Analysis: Comparing SAP SE and Fortinet, Inc.
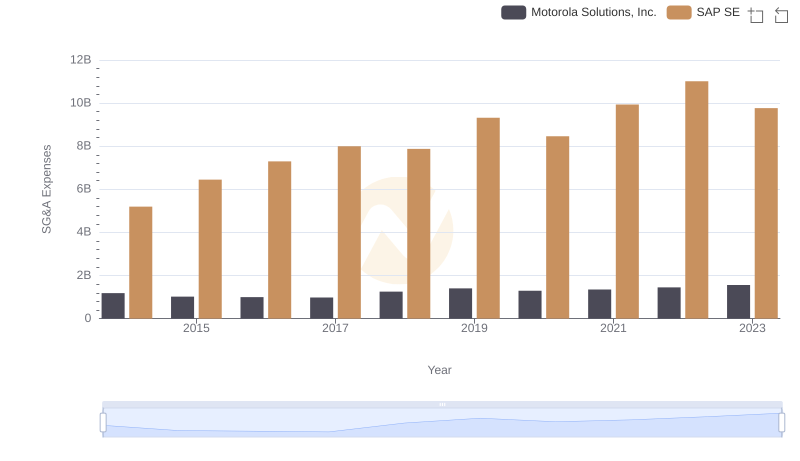
SAP SE and Motorola Solutions, Inc.: SG&A Spending Patterns Compared
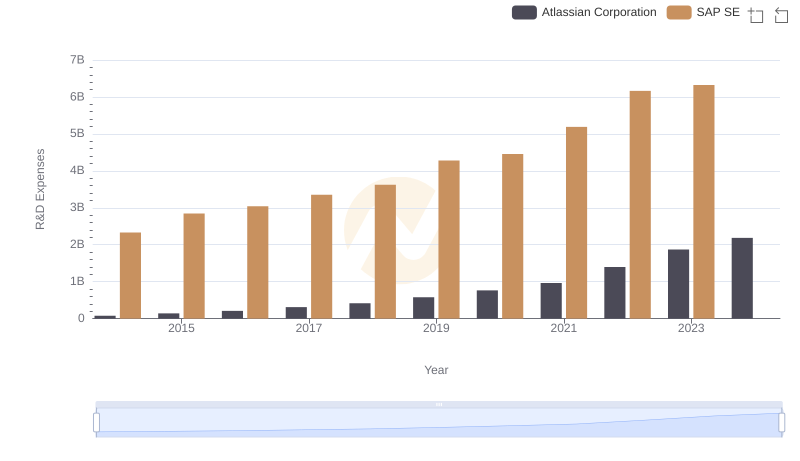
Research and Development: Comparing Key Metrics for SAP SE and Atlassian Corporation
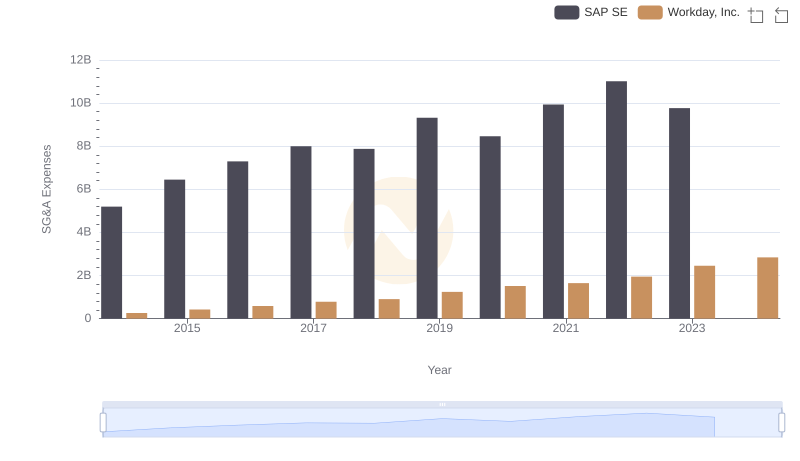
SAP SE vs Workday, Inc.: SG&A Expense Trends
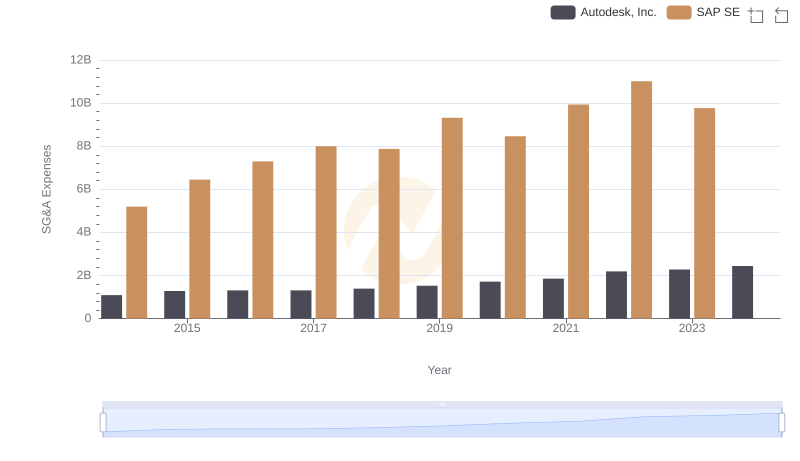
Breaking Down SG&A Expenses: SAP SE vs Autodesk, Inc.
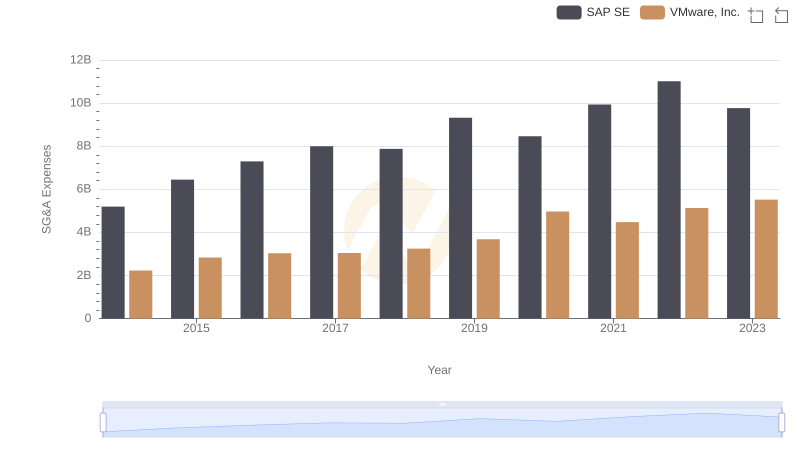
Operational Costs Compared: SG&A Analysis of SAP SE and VMware, Inc.
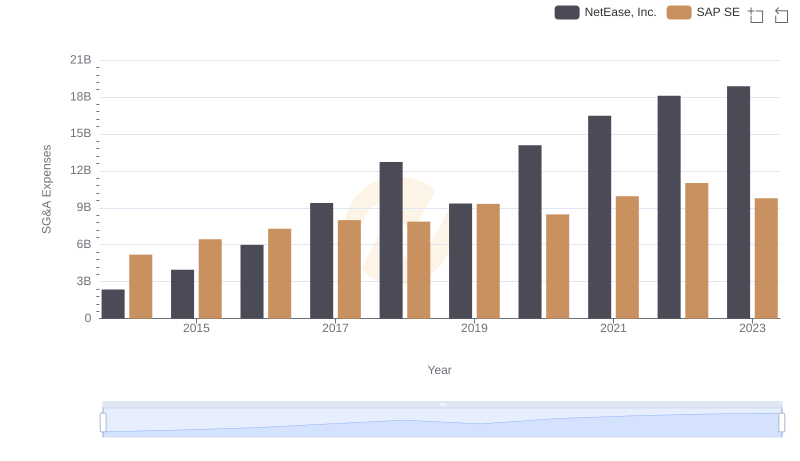
SAP SE vs NetEase, Inc.: SG&A Expense Trends
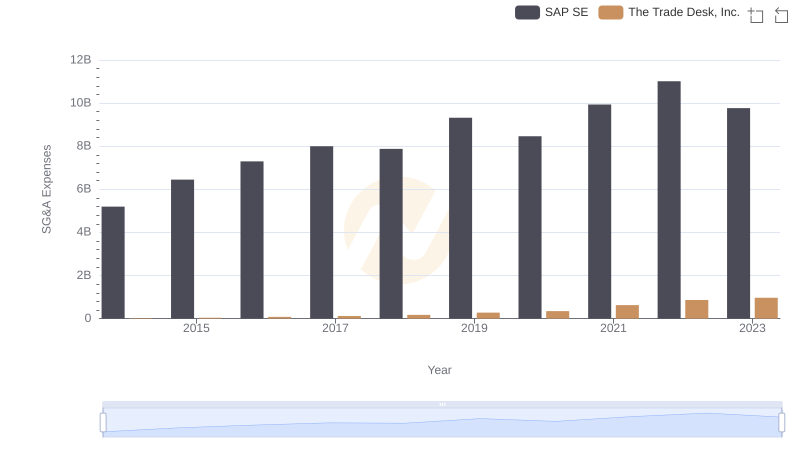
Selling, General, and Administrative Costs: SAP SE vs The Trade Desk, Inc.