| __timestamp | Atlassian Corporation | SAP SE |
|---|---|---|
| Wednesday, January 1, 2014 | 37986000 | 5272000000 |
| Thursday, January 1, 2015 | 52932000 | 6626000000 |
| Friday, January 1, 2016 | 75783000 | 6570000000 |
| Sunday, January 1, 2017 | 119161000 | 7051000000 |
| Monday, January 1, 2018 | 172690000 | 7462000000 |
| Tuesday, January 1, 2019 | 210285000 | 8351000000 |
| Wednesday, January 1, 2020 | 268807000 | 7886000000 |
| Friday, January 1, 2021 | 336021000 | 7946000000 |
| Saturday, January 1, 2022 | 465707000 | 8936000000 |
| Sunday, January 1, 2023 | 633765000 | 8604000000 |
| Monday, January 1, 2024 | 803495000 | 9164000000 |
Unlocking the unknown
In the ever-evolving landscape of global technology, understanding the cost of revenue is crucial for evaluating a company's financial health. Over the past decade, SAP SE and Atlassian Corporation have demonstrated contrasting trajectories in their cost of revenue. From 2014 to 2023, Atlassian's cost of revenue surged by over 2000%, reflecting its rapid expansion and increased operational scale. In contrast, SAP SE's cost of revenue remained relatively stable, with a modest increase of around 63% over the same period, highlighting its established market presence and efficient cost management.
Interestingly, the data for 2024 shows a missing value for SAP SE, indicating potential reporting delays or strategic shifts. This comparison not only underscores the dynamic nature of the tech industry but also offers insights into how these giants manage their resources to maintain competitive edges.
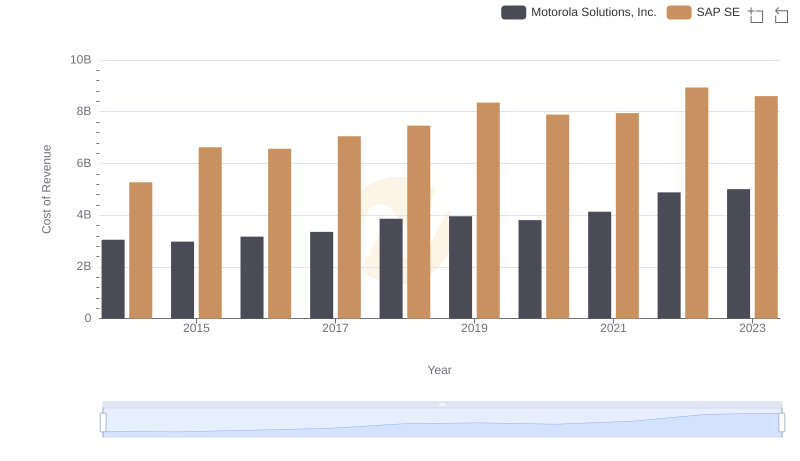
Comparing Cost of Revenue Efficiency: SAP SE vs Motorola Solutions, Inc.
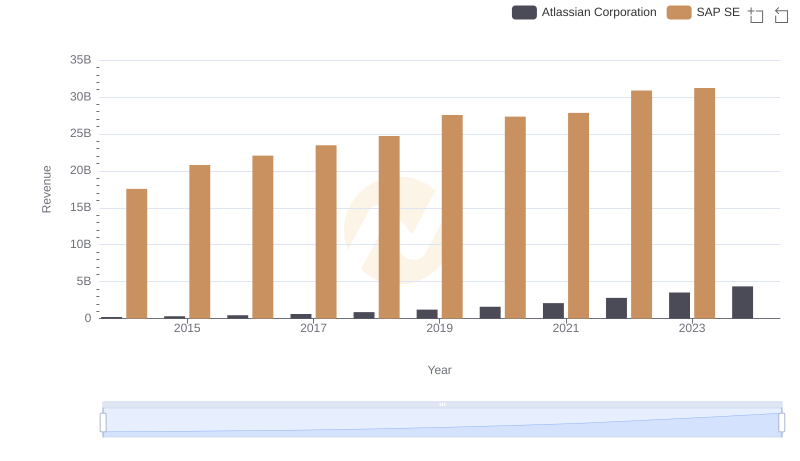
SAP SE vs Atlassian Corporation: Examining Key Revenue Metrics
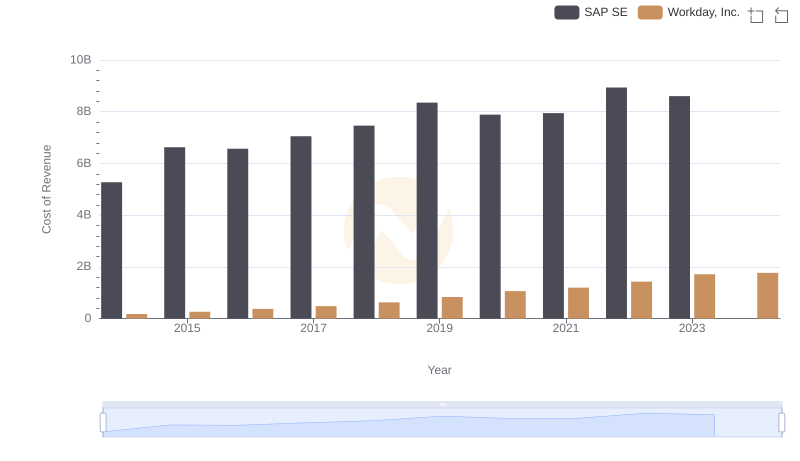
Cost of Revenue: Key Insights for SAP SE and Workday, Inc.
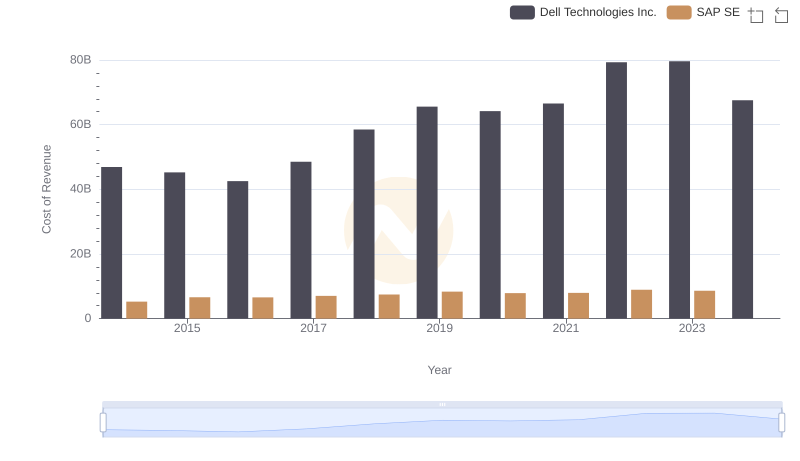
Comparing Cost of Revenue Efficiency: SAP SE vs Dell Technologies Inc.
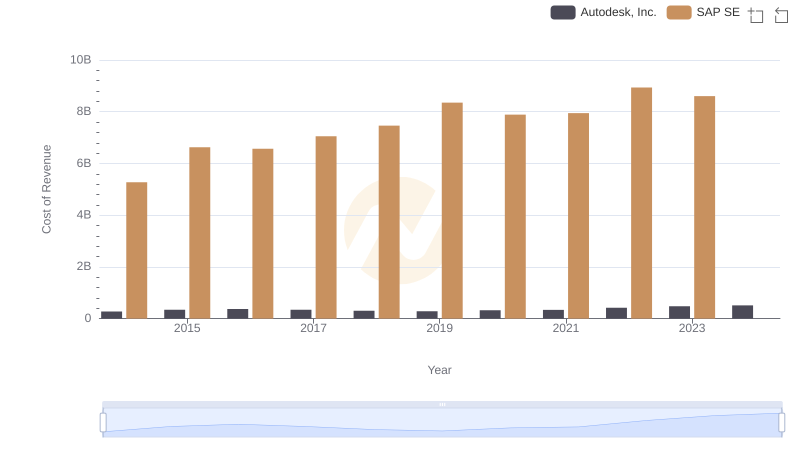
Cost of Revenue Trends: SAP SE vs Autodesk, Inc.
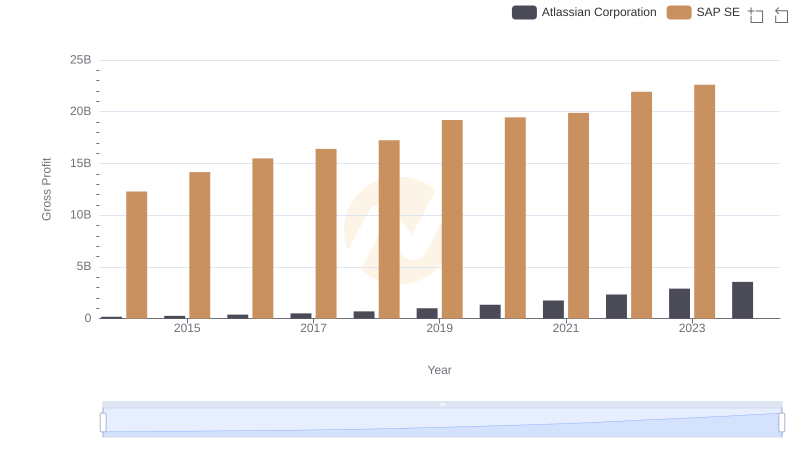
Gross Profit Comparison: SAP SE and Atlassian Corporation Trends
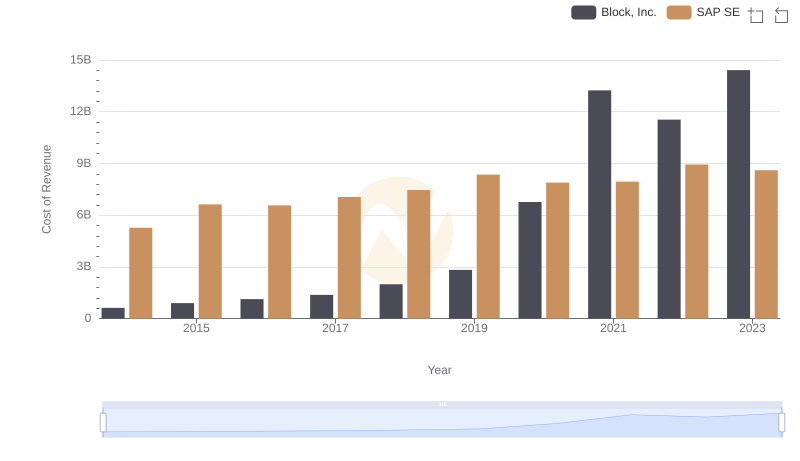
SAP SE vs Block, Inc.: Efficiency in Cost of Revenue Explored
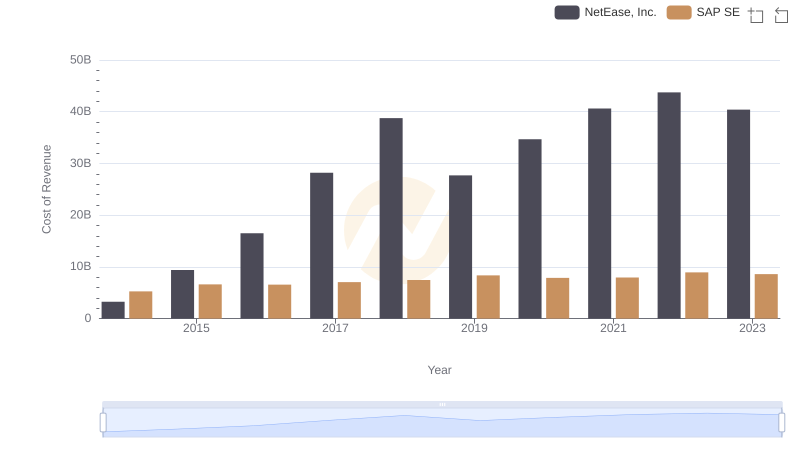
SAP SE vs NetEase, Inc.: Efficiency in Cost of Revenue Explored
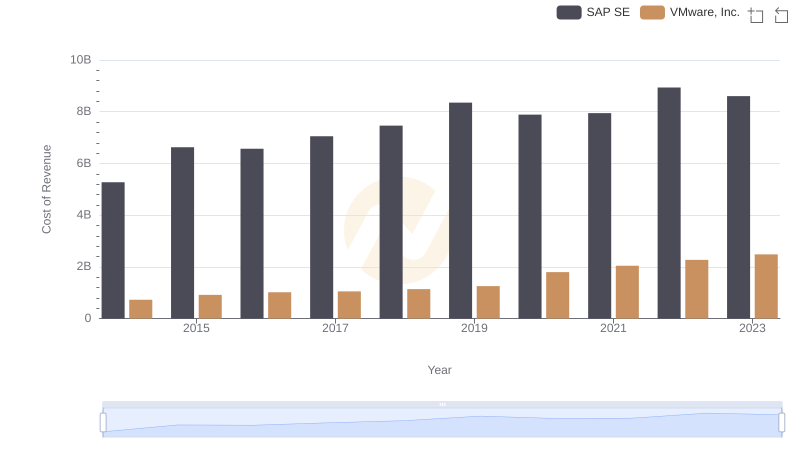
SAP SE vs VMware, Inc.: Efficiency in Cost of Revenue Explored
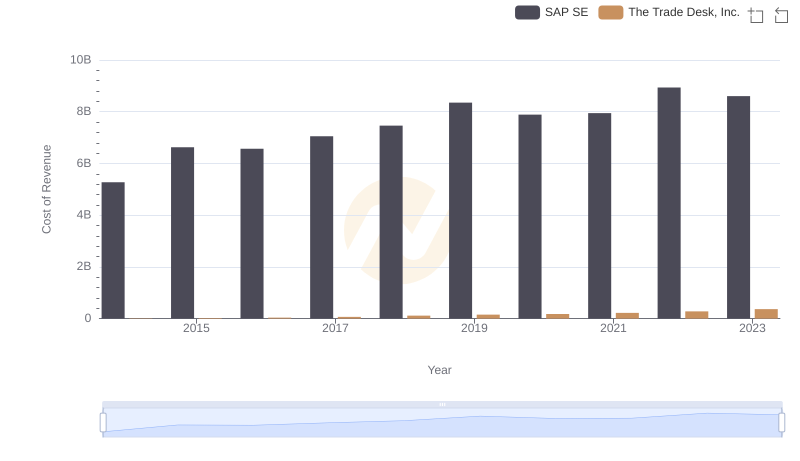
Cost Insights: Breaking Down SAP SE and The Trade Desk, Inc.'s Expenses
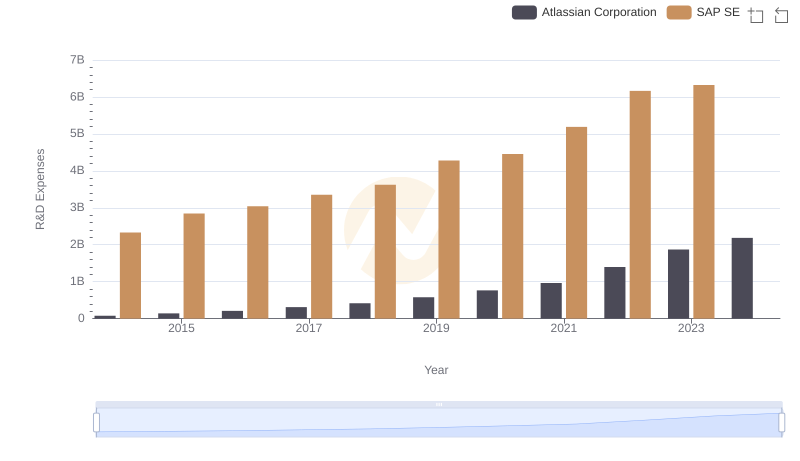
Research and Development: Comparing Key Metrics for SAP SE and Atlassian Corporation
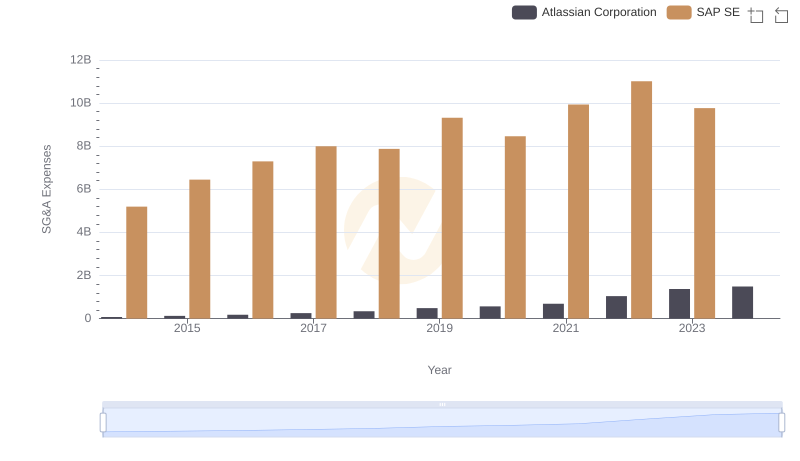
SAP SE vs Atlassian Corporation: SG&A Expense Trends