| __timestamp | Emerson Electric Co. | RTX Corporation |
|---|---|---|
| Wednesday, January 1, 2014 | 10158000000 | 17653000000 |
| Thursday, January 1, 2015 | 9048000000 | 15667000000 |
| Friday, January 1, 2016 | 6262000000 | 15784000000 |
| Sunday, January 1, 2017 | 6404000000 | 15884000000 |
| Monday, January 1, 2018 | 7460000000 | 16516000000 |
| Tuesday, January 1, 2019 | 7815000000 | 19981000000 |
| Wednesday, January 1, 2020 | 7009000000 | 8531000000 |
| Friday, January 1, 2021 | 7563000000 | 12491000000 |
| Saturday, January 1, 2022 | 8188000000 | 13668000000 |
| Sunday, January 1, 2023 | 7427000000 | 12089000000 |
| Monday, January 1, 2024 | 7808000000 | 15410000000 |
In pursuit of knowledge
In the competitive landscape of industrial giants, RTX Corporation and Emerson Electric Co. have showcased intriguing trends in their gross profit performance over the past decade. From 2014 to 2024, RTX Corporation consistently outperformed Emerson Electric Co., with an average gross profit nearly double that of its competitor. Notably, RTX's gross profit peaked in 2019, reaching approximately 20% higher than its 2014 figures, before experiencing a dip in 2020, likely due to global economic challenges.
Emerson Electric Co., on the other hand, demonstrated a more stable trajectory, with its gross profit fluctuating modestly around its average. Despite a significant drop in 2016, Emerson managed to recover, maintaining a steady performance through 2024. This analysis highlights the resilience and strategic adaptability of these industrial leaders, offering valuable insights into their financial health and market strategies.
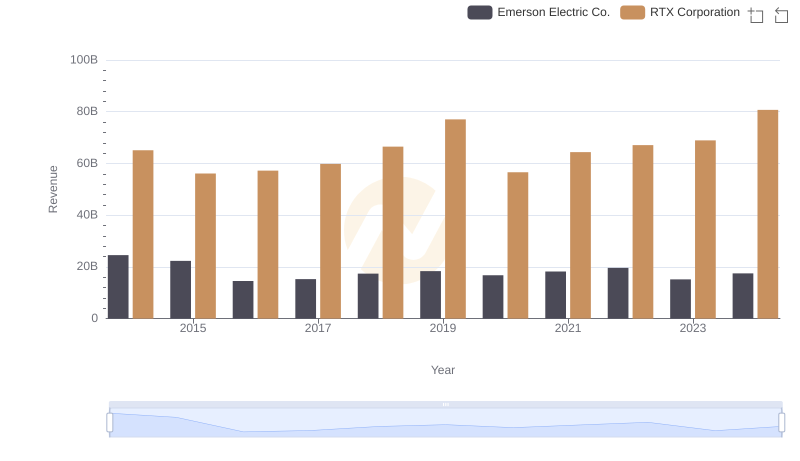
Annual Revenue Comparison: RTX Corporation vs Emerson Electric Co.
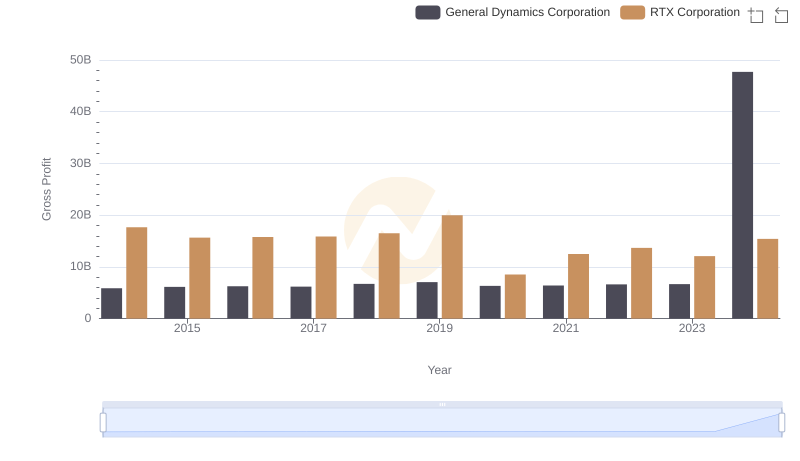
Gross Profit Analysis: Comparing RTX Corporation and General Dynamics Corporation
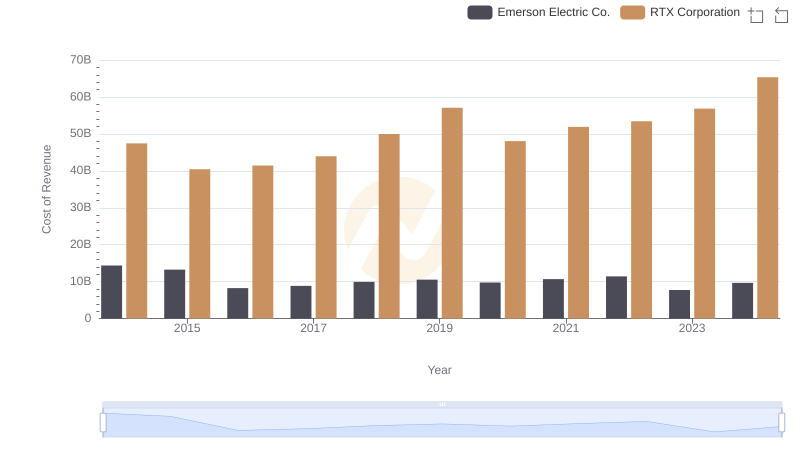
Cost of Revenue: Key Insights for RTX Corporation and Emerson Electric Co.
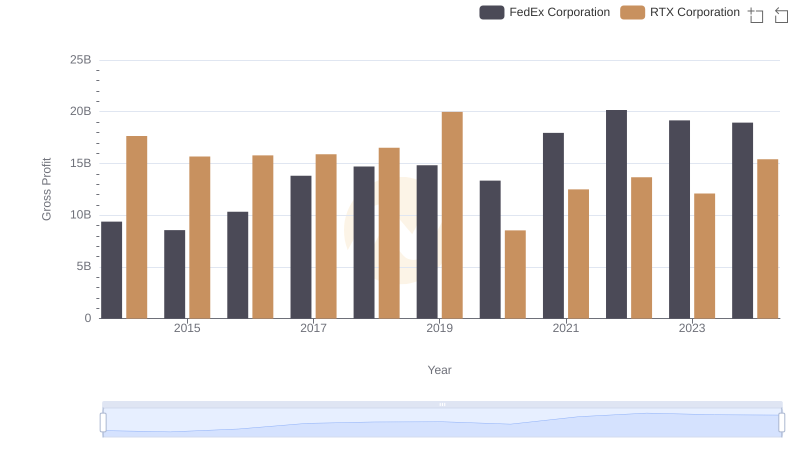
Who Generates Higher Gross Profit? RTX Corporation or FedEx Corporation
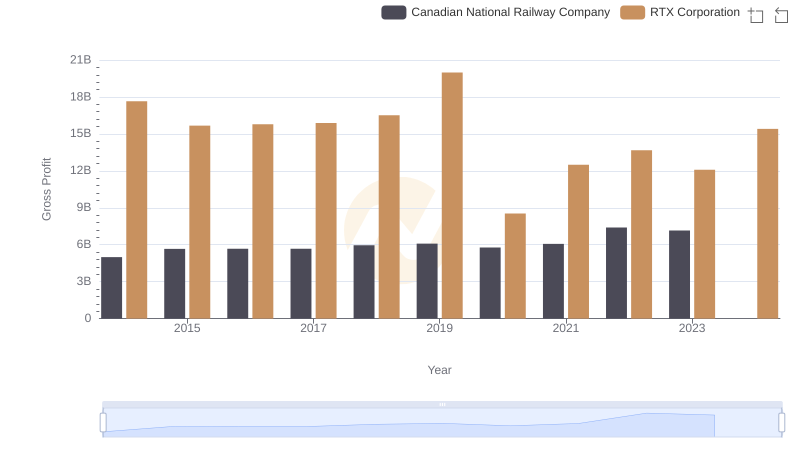
Gross Profit Trends Compared: RTX Corporation vs Canadian National Railway Company
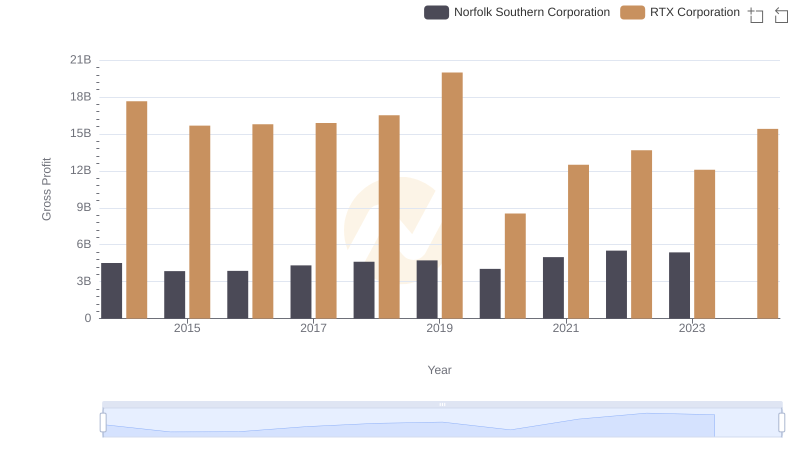
Gross Profit Comparison: RTX Corporation and Norfolk Southern Corporation Trends
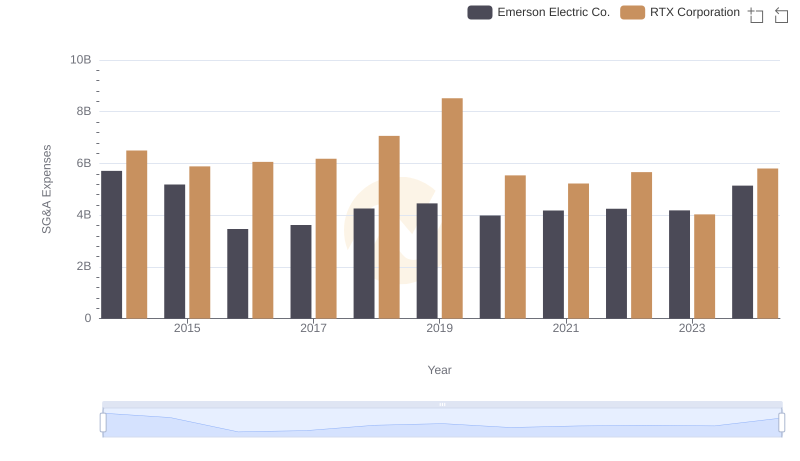
Breaking Down SG&A Expenses: RTX Corporation vs Emerson Electric Co.