| __timestamp | Emerson Electric Co. | RTX Corporation |
|---|---|---|
| Wednesday, January 1, 2014 | 14379000000 | 47447000000 |
| Thursday, January 1, 2015 | 13256000000 | 40431000000 |
| Friday, January 1, 2016 | 8260000000 | 41460000000 |
| Sunday, January 1, 2017 | 8860000000 | 43953000000 |
| Monday, January 1, 2018 | 9948000000 | 49985000000 |
| Tuesday, January 1, 2019 | 10557000000 | 57065000000 |
| Wednesday, January 1, 2020 | 9776000000 | 48056000000 |
| Friday, January 1, 2021 | 10673000000 | 51897000000 |
| Saturday, January 1, 2022 | 11441000000 | 53406000000 |
| Sunday, January 1, 2023 | 7738000000 | 56831000000 |
| Monday, January 1, 2024 | 9684000000 | 65328000000 |
Cracking the code
In the ever-evolving landscape of industrial giants, understanding cost dynamics is crucial. From 2014 to 2024, RTX Corporation and Emerson Electric Co. have showcased distinct trajectories in their cost of revenue. RTX Corporation, a leader in aerospace and defense, has seen a steady increase, peaking in 2024 with a 38% rise from its 2014 figures. This growth reflects strategic investments and market expansion. Conversely, Emerson Electric Co., a stalwart in automation solutions, experienced fluctuations, with a notable dip in 2023, marking a 46% decrease from its 2014 peak. This volatility underscores the challenges in maintaining cost efficiency amidst global economic shifts. As we look to the future, these trends offer valuable insights into the operational strategies of these industry titans, highlighting the importance of adaptive cost management in sustaining competitive advantage.
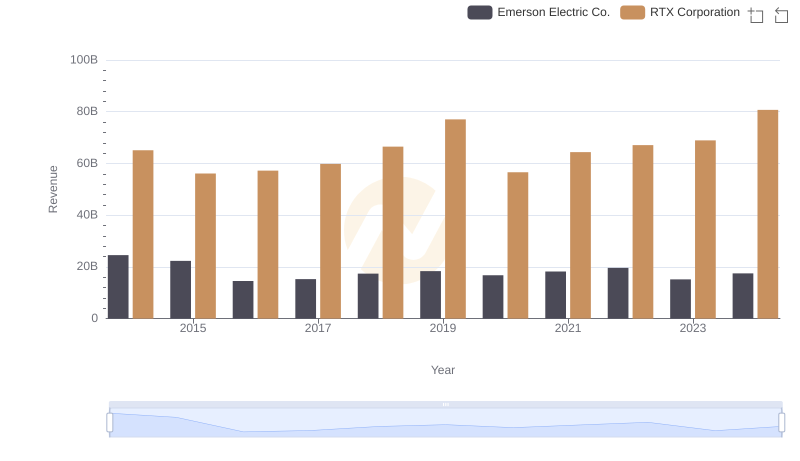
Annual Revenue Comparison: RTX Corporation vs Emerson Electric Co.
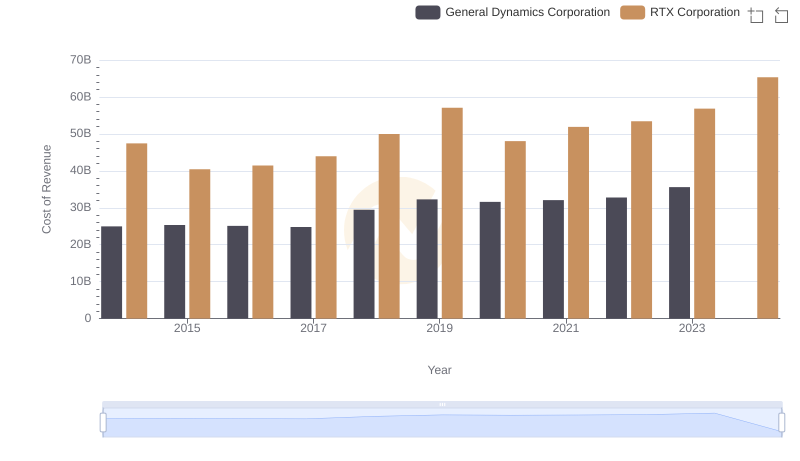
RTX Corporation vs General Dynamics Corporation: Efficiency in Cost of Revenue Explored
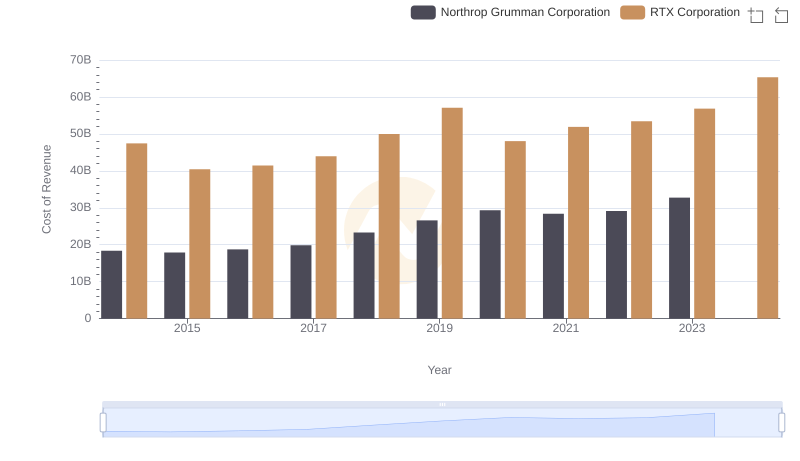
RTX Corporation vs Northrop Grumman Corporation: Efficiency in Cost of Revenue Explored
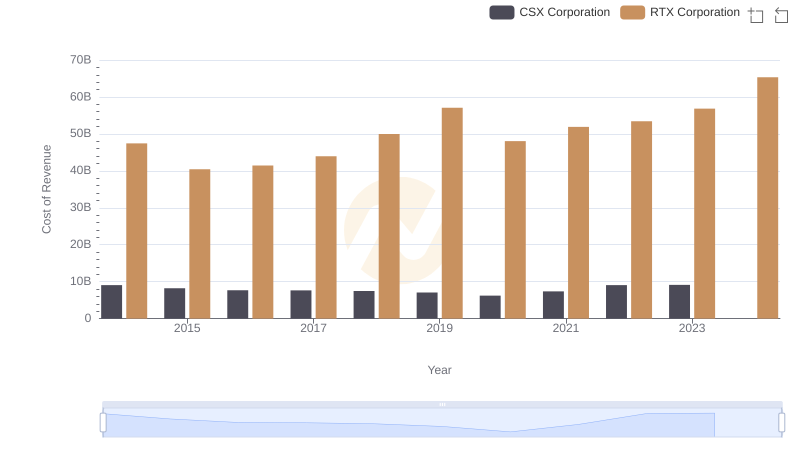
Cost Insights: Breaking Down RTX Corporation and CSX Corporation's Expenses
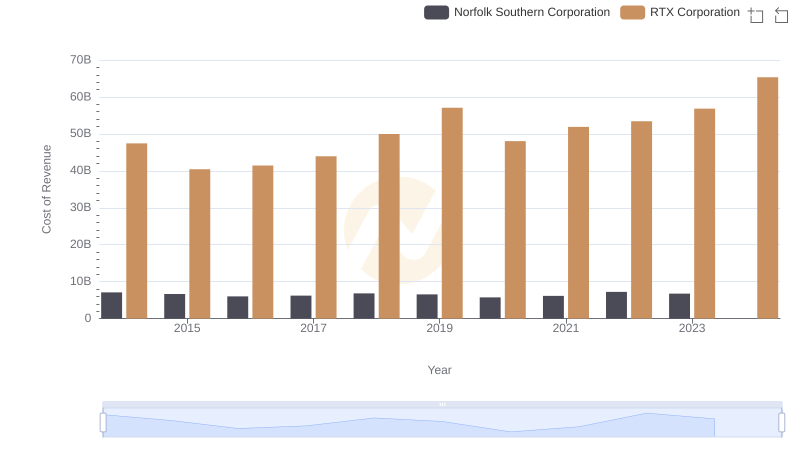
Cost Insights: Breaking Down RTX Corporation and Norfolk Southern Corporation's Expenses
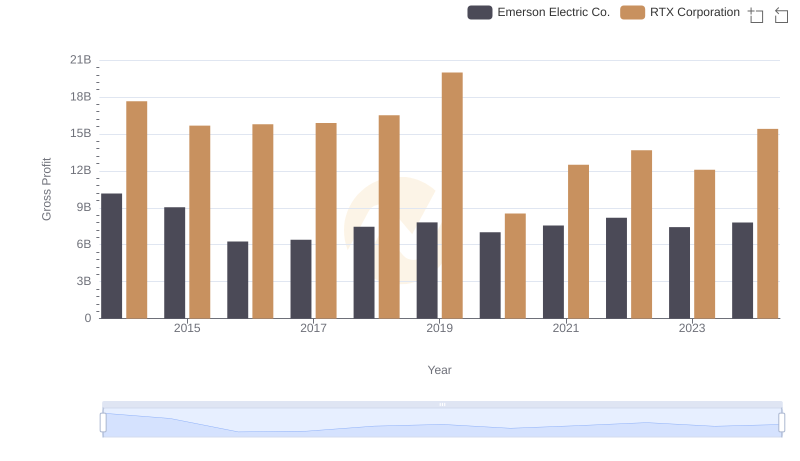
RTX Corporation vs Emerson Electric Co.: A Gross Profit Performance Breakdown
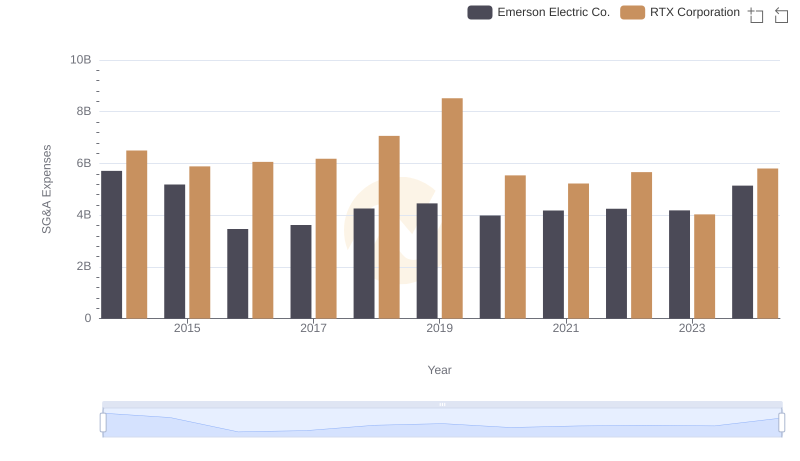
Breaking Down SG&A Expenses: RTX Corporation vs Emerson Electric Co.