| __timestamp | The Boeing Company | Trane Technologies plc |
|---|---|---|
| Wednesday, January 1, 2014 | 90762000000 | 12891400000 |
| Thursday, January 1, 2015 | 96114000000 | 13300700000 |
| Friday, January 1, 2016 | 94571000000 | 13508900000 |
| Sunday, January 1, 2017 | 93392000000 | 14197600000 |
| Monday, January 1, 2018 | 101127000000 | 15668200000 |
| Tuesday, January 1, 2019 | 76559000000 | 16598900000 |
| Wednesday, January 1, 2020 | 58158000000 | 12454700000 |
| Friday, January 1, 2021 | 62286000000 | 14136400000 |
| Saturday, January 1, 2022 | 66608000000 | 15991700000 |
| Sunday, January 1, 2023 | 77794000000 | 17677600000 |
| Monday, January 1, 2024 | 66517000000 | 19838200000 |
In pursuit of knowledge
In the ever-evolving aerospace and industrial sectors, understanding revenue trends is crucial. Over the past decade, The Boeing Company and Trane Technologies plc have showcased contrasting financial trajectories. Boeing, a titan in aerospace, saw its revenue peak in 2018, only to face a significant downturn by 2020, with a 42% drop. This decline reflects the broader challenges faced by the aviation industry during the pandemic. In contrast, Trane Technologies, a leader in climate solutions, demonstrated resilience with a steady revenue increase, culminating in a 37% rise from 2014 to 2023. Notably, 2023 marked a high point for Trane, while Boeing showed signs of recovery. These insights highlight the dynamic nature of these industries and the importance of strategic adaptation. Missing data for 2024 suggests ongoing volatility, urging stakeholders to stay informed and agile.
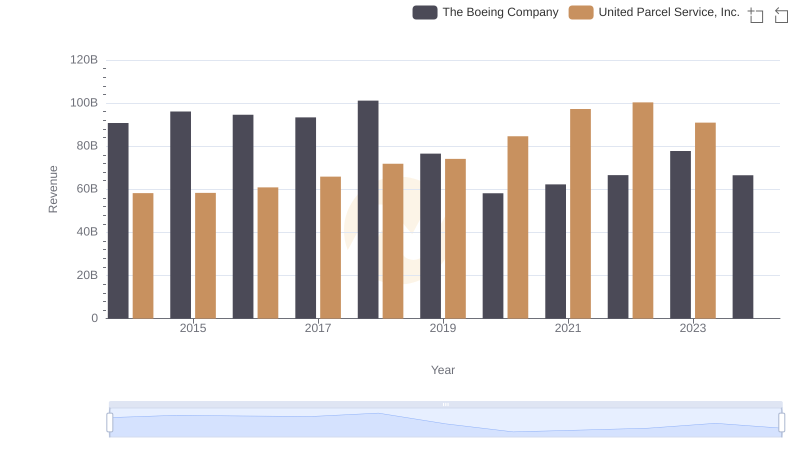
Who Generates More Revenue? The Boeing Company or United Parcel Service, Inc.
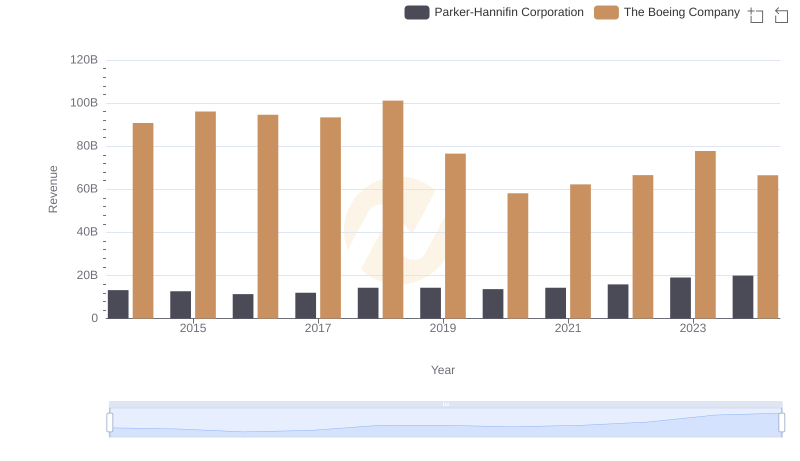
Revenue Showdown: The Boeing Company vs Parker-Hannifin Corporation
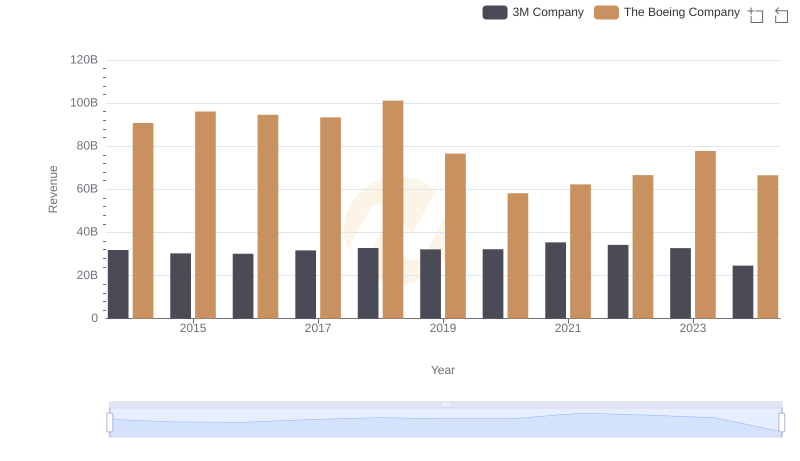
The Boeing Company or 3M Company: Who Leads in Yearly Revenue?
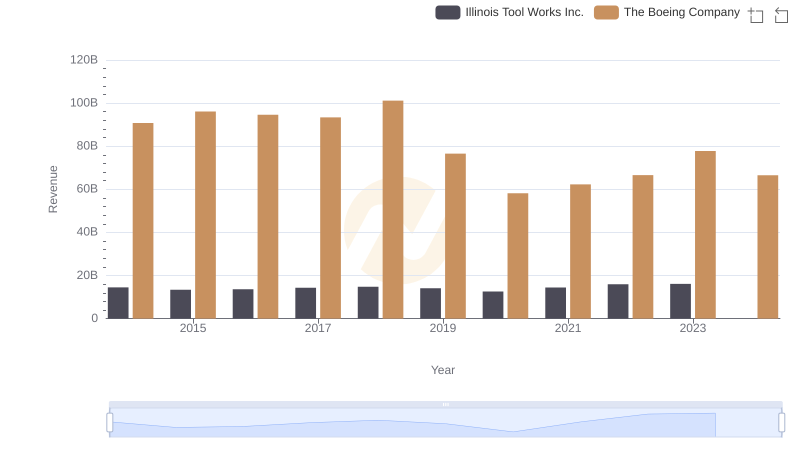
The Boeing Company and Illinois Tool Works Inc.: A Comprehensive Revenue Analysis
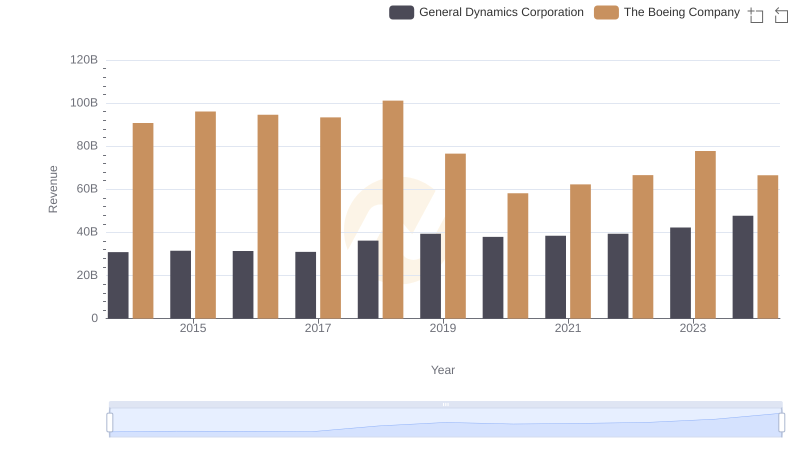
The Boeing Company and General Dynamics Corporation: A Comprehensive Revenue Analysis
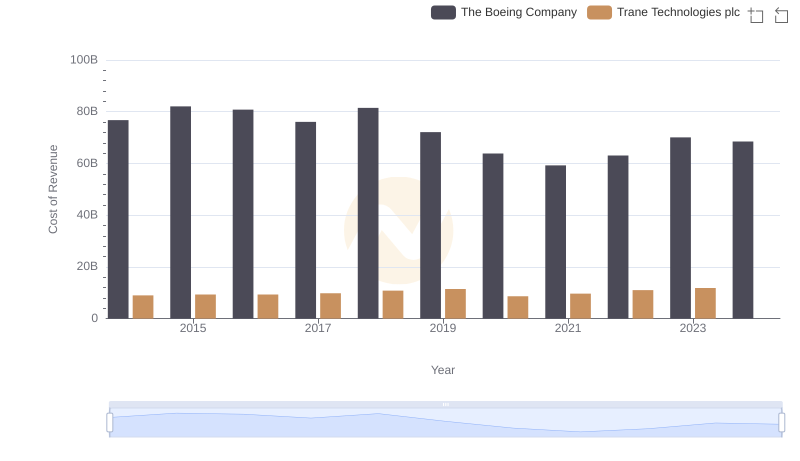
Comparing Cost of Revenue Efficiency: The Boeing Company vs Trane Technologies plc