| __timestamp | Delta Air Lines, Inc. | Textron Inc. |
|---|---|---|
| Wednesday, January 1, 2014 | 40362000000 | 13878000000 |
| Thursday, January 1, 2015 | 40704000000 | 13423000000 |
| Friday, January 1, 2016 | 39639000000 | 13788000000 |
| Sunday, January 1, 2017 | 41138000000 | 14198000000 |
| Monday, January 1, 2018 | 44438000000 | 13972000000 |
| Tuesday, January 1, 2019 | 47007000000 | 13630000000 |
| Wednesday, January 1, 2020 | 17095000000 | 11651000000 |
| Friday, January 1, 2021 | 29899000000 | 12382000000 |
| Saturday, January 1, 2022 | 50582000000 | 12869000000 |
| Sunday, January 1, 2023 | 58048000000 | 13683000000 |
| Monday, January 1, 2024 | 61643000000 | 13702000000 |
Unleashing insights
In the ever-evolving landscape of the aviation and manufacturing industries, Delta Air Lines, Inc. and Textron Inc. stand as titans with distinct trajectories. Over the past decade, Delta Air Lines has soared, with its revenue nearly doubling from 2014 to 2024, showcasing a remarkable recovery post-2020. The pandemic year of 2020 saw a dramatic dip, with revenues plummeting by over 60%, but the airline rebounded strongly, achieving a 20% increase in 2023 alone.
Conversely, Textron Inc. has maintained a steady course, with revenues fluctuating modestly around the $13 billion mark. Despite the challenges of 2020, Textron's resilience is evident, with a gradual recovery and a 2% increase in 2023. This comparison highlights the dynamic nature of these industries and the resilience of these companies in navigating economic turbulence.
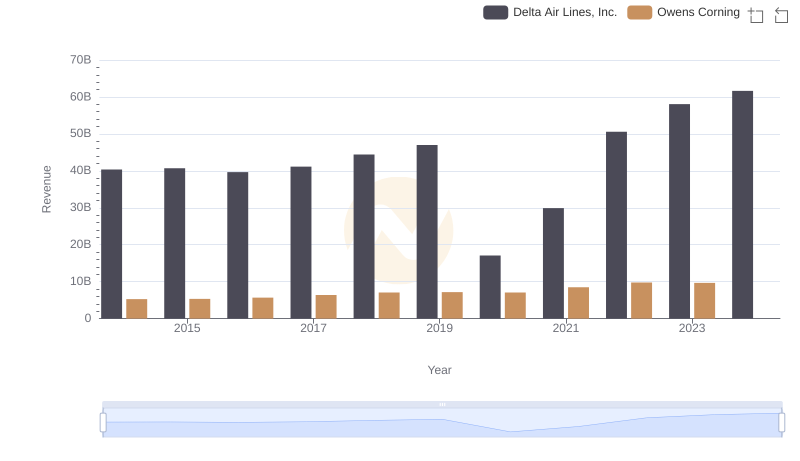
Revenue Showdown: Delta Air Lines, Inc. vs Owens Corning
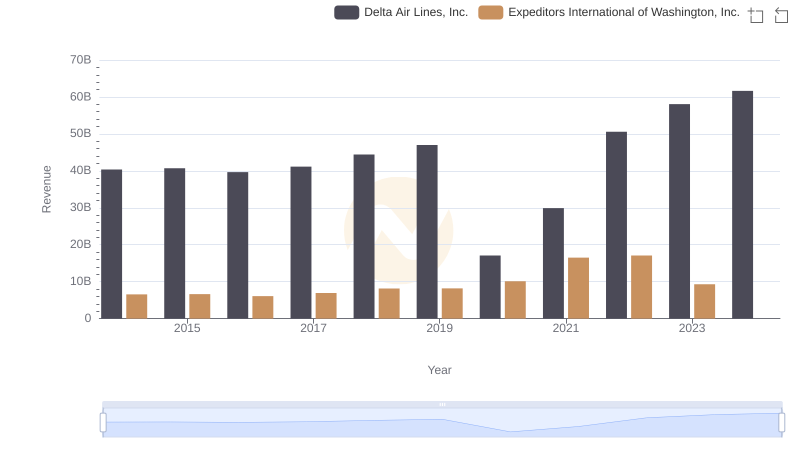
Delta Air Lines, Inc. and Expeditors International of Washington, Inc.: A Comprehensive Revenue Analysis
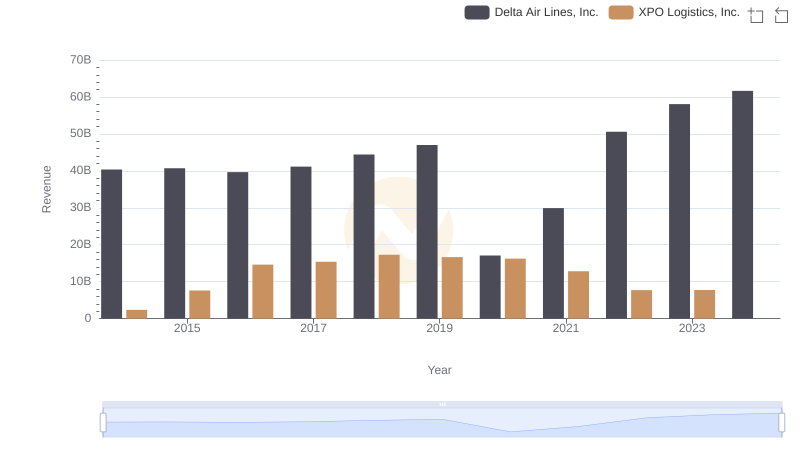
Delta Air Lines, Inc. and XPO Logistics, Inc.: A Comprehensive Revenue Analysis
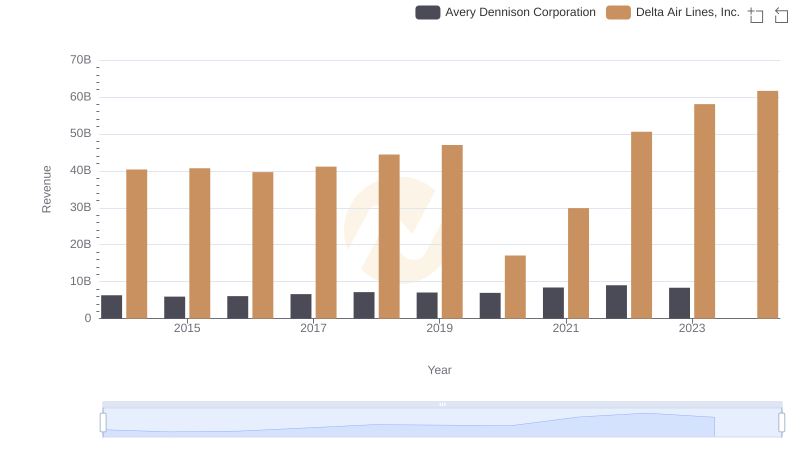
Revenue Showdown: Delta Air Lines, Inc. vs Avery Dennison Corporation
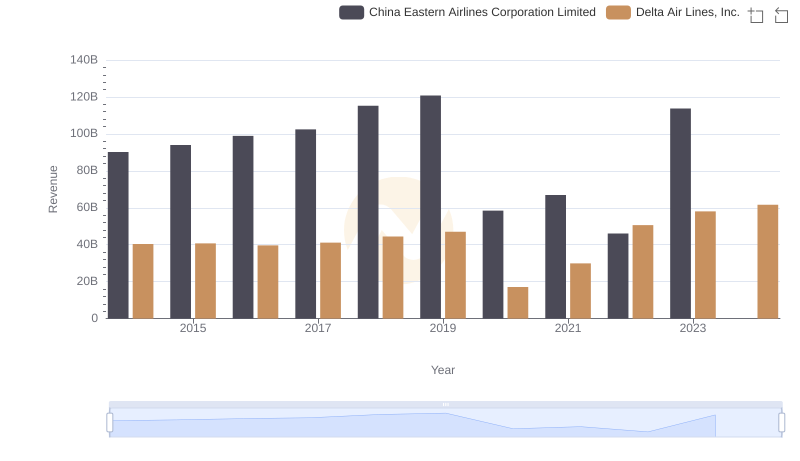
Revenue Showdown: Delta Air Lines, Inc. vs China Eastern Airlines Corporation Limited
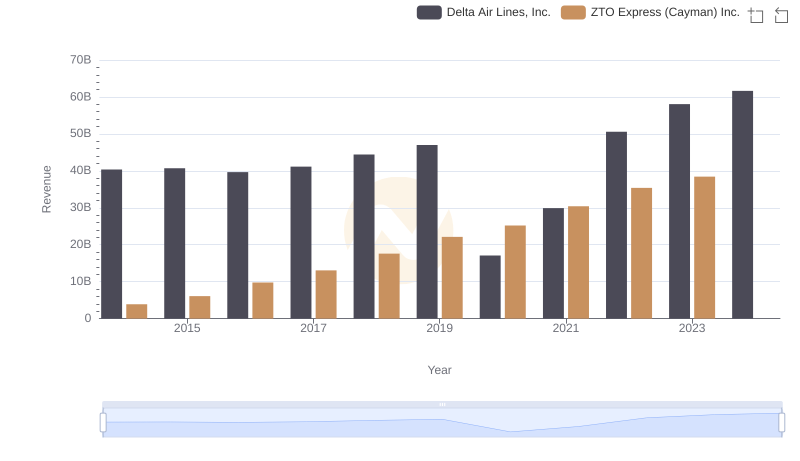
Comparing Revenue Performance: Delta Air Lines, Inc. or ZTO Express (Cayman) Inc.?
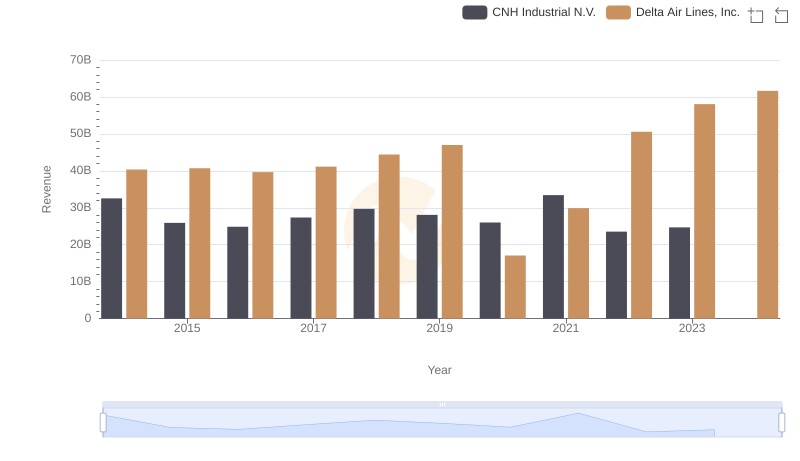
Delta Air Lines, Inc. and CNH Industrial N.V.: A Comprehensive Revenue Analysis
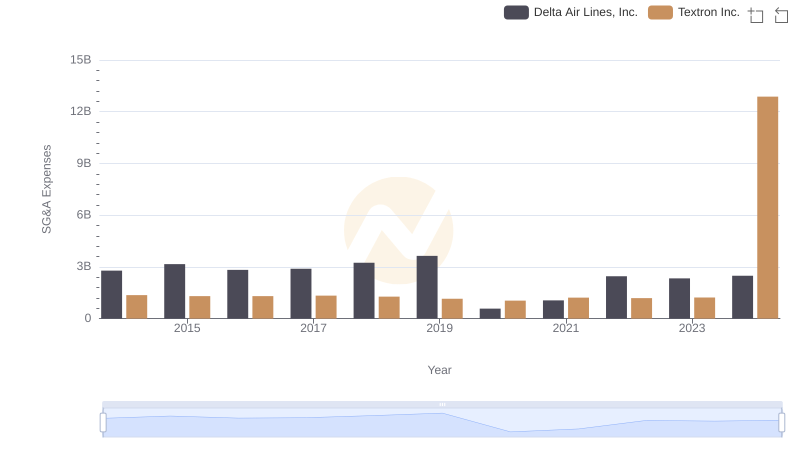
Delta Air Lines, Inc. and Textron Inc.: SG&A Spending Patterns Compared
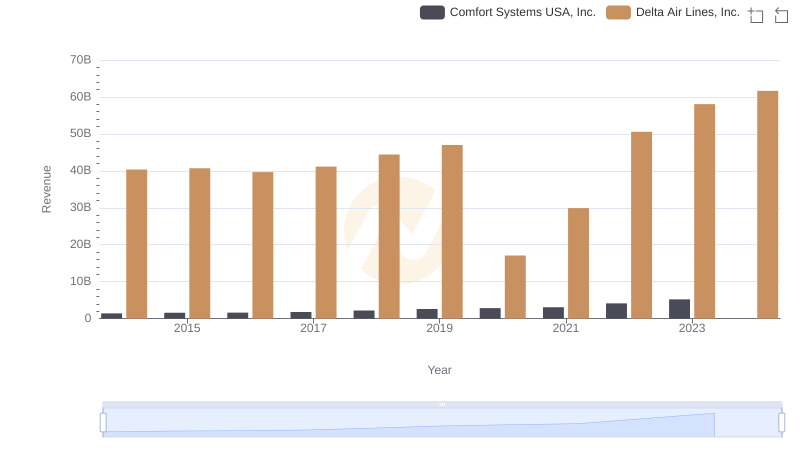
Comparing Revenue Performance: Delta Air Lines, Inc. or Comfort Systems USA, Inc.?
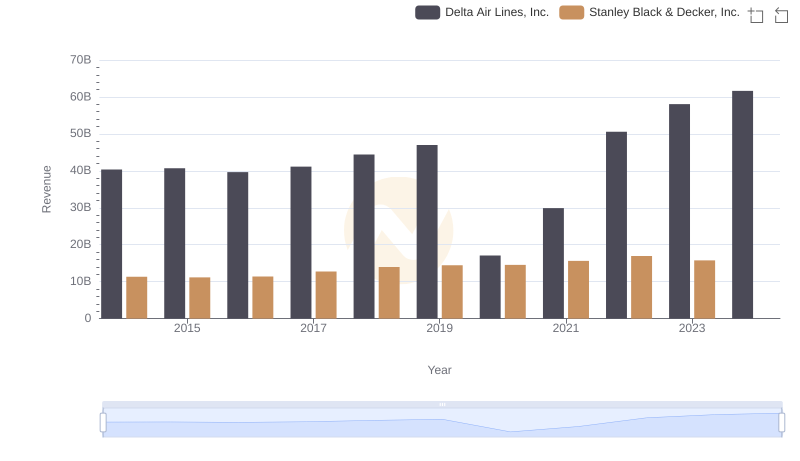
Annual Revenue Comparison: Delta Air Lines, Inc. vs Stanley Black & Decker, Inc.
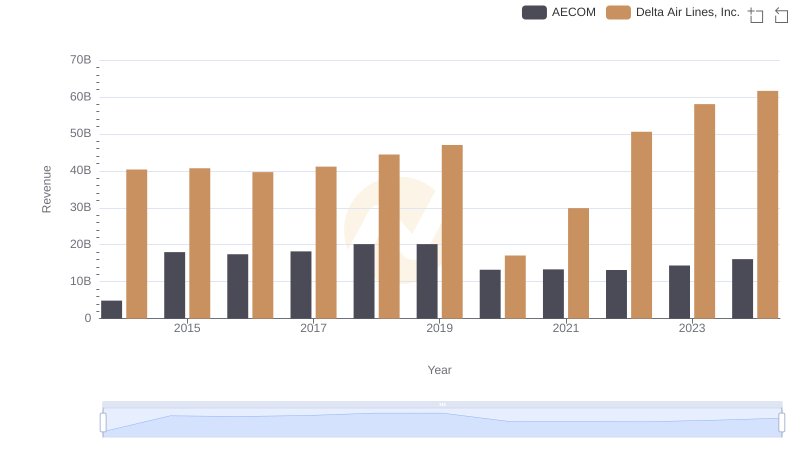
Delta Air Lines, Inc. and AECOM: A Comprehensive Revenue Analysis