| __timestamp | Delta Air Lines, Inc. | Stanley Black & Decker, Inc. |
|---|---|---|
| Wednesday, January 1, 2014 | 40362000000 | 11338600000 |
| Thursday, January 1, 2015 | 40704000000 | 11171800000 |
| Friday, January 1, 2016 | 39639000000 | 11406900000 |
| Sunday, January 1, 2017 | 41138000000 | 12747200000 |
| Monday, January 1, 2018 | 44438000000 | 13982400000 |
| Tuesday, January 1, 2019 | 47007000000 | 14442200000 |
| Wednesday, January 1, 2020 | 17095000000 | 14534600000 |
| Friday, January 1, 2021 | 29899000000 | 15617200000 |
| Saturday, January 1, 2022 | 50582000000 | 16947400000 |
| Sunday, January 1, 2023 | 58048000000 | 15781100000 |
| Monday, January 1, 2024 | 61643000000 | 15365700000 |
Cracking the code
In the ever-evolving landscape of American industry, Delta Air Lines and Stanley Black & Decker stand as titans in their respective fields. Over the past decade, Delta Air Lines has soared, with its revenue peaking at an impressive $61.6 billion in 2024, marking a staggering 52% increase from its 2014 figures. This growth trajectory highlights Delta's resilience and adaptability, especially in the face of global challenges like the 2020 downturn.
Conversely, Stanley Black & Decker, a stalwart in the tools and storage sector, has shown steady growth, with revenues climbing from $11.3 billion in 2014 to $15.8 billion in 2023. This represents a solid 40% increase, underscoring its consistent market presence. However, data for 2024 remains elusive, leaving room for speculation on its future performance.
These insights offer a fascinating glimpse into the dynamics of two industry leaders, each navigating their unique paths to success.
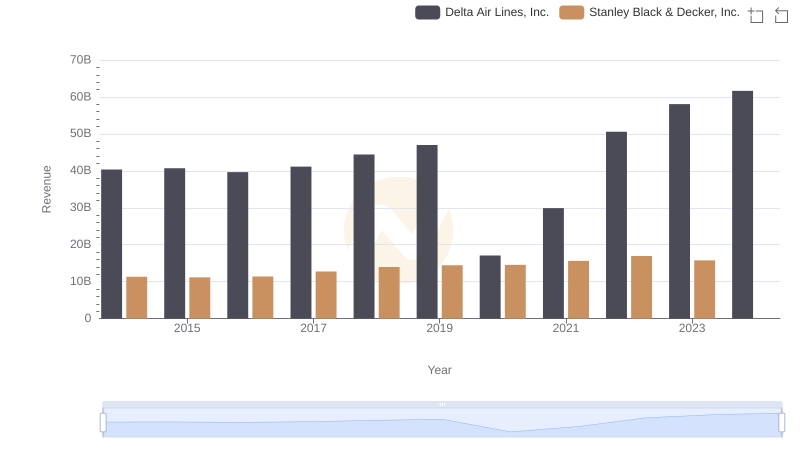
Who Generates More Revenue? Delta Air Lines, Inc. or Stanley Black & Decker, Inc.
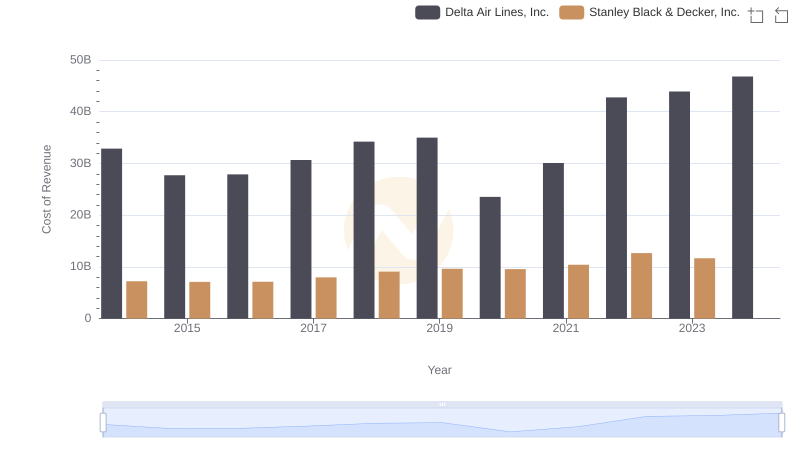
Cost of Revenue Comparison: Delta Air Lines, Inc. vs Stanley Black & Decker, Inc.
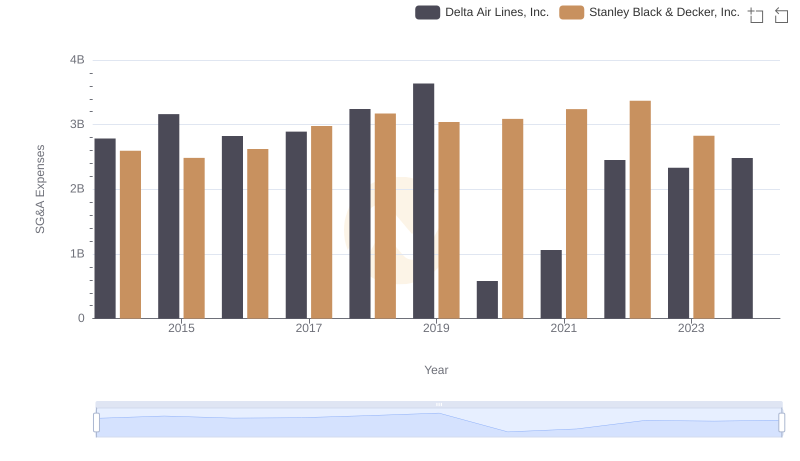
Selling, General, and Administrative Costs: Delta Air Lines, Inc. vs Stanley Black & Decker, Inc.
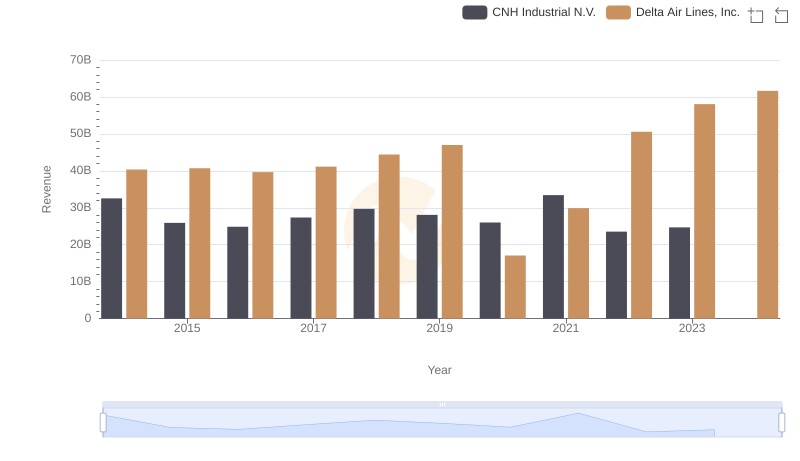
Delta Air Lines, Inc. and CNH Industrial N.V.: A Comprehensive Revenue Analysis
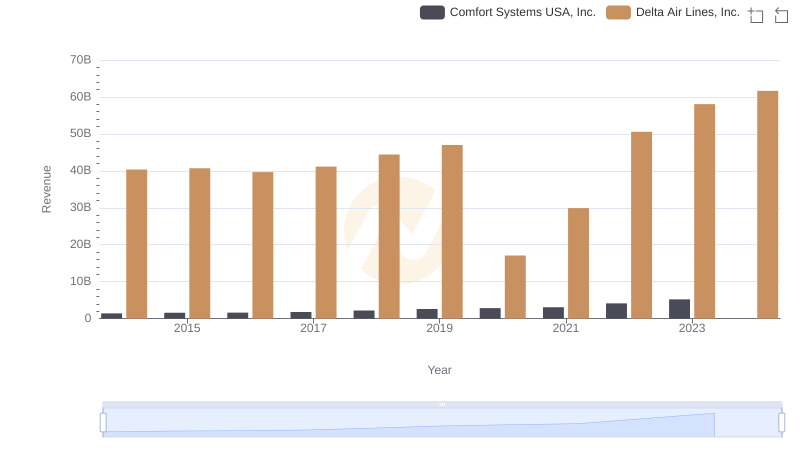
Comparing Revenue Performance: Delta Air Lines, Inc. or Comfort Systems USA, Inc.?
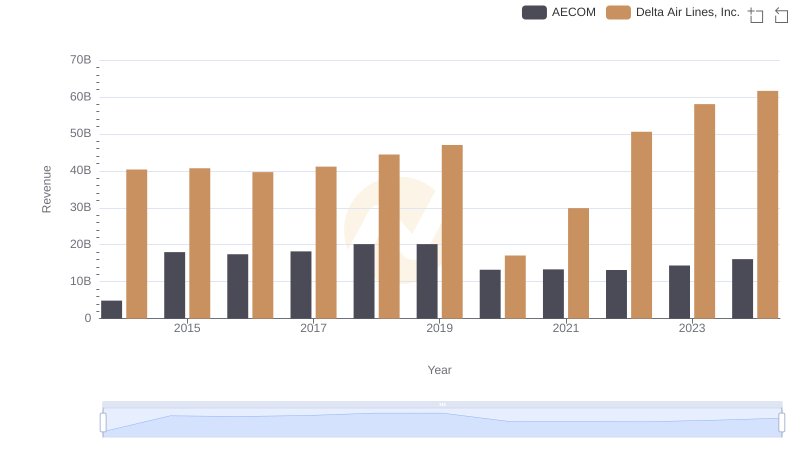
Delta Air Lines, Inc. and AECOM: A Comprehensive Revenue Analysis
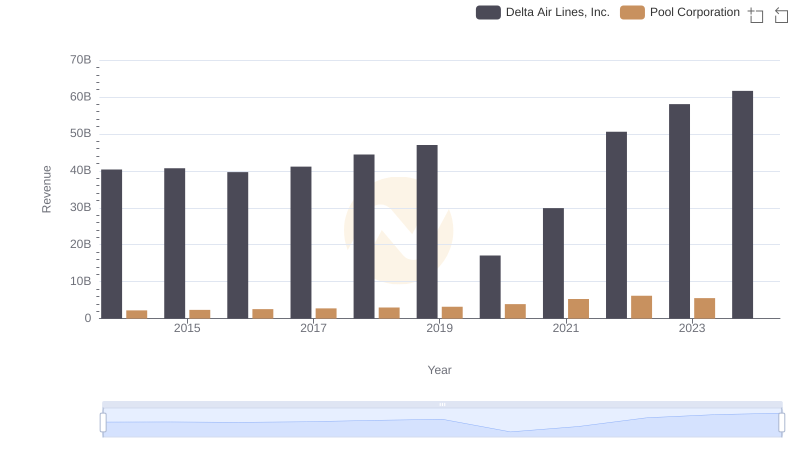
Delta Air Lines, Inc. vs Pool Corporation: Annual Revenue Growth Compared
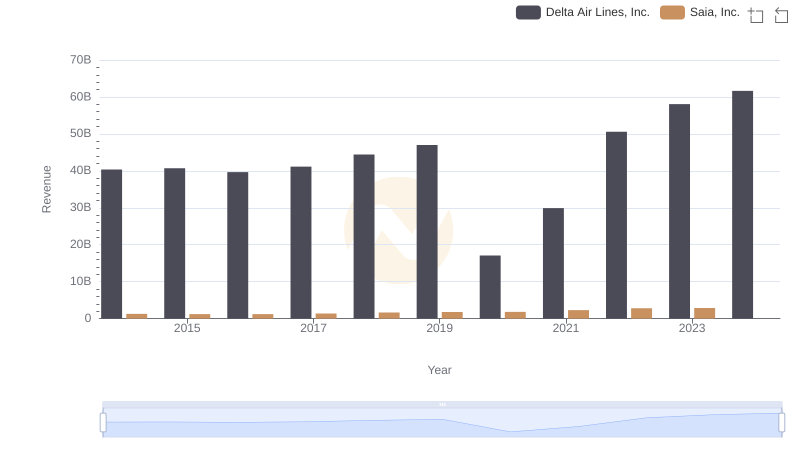
Delta Air Lines, Inc. vs Saia, Inc.: Examining Key Revenue Metrics
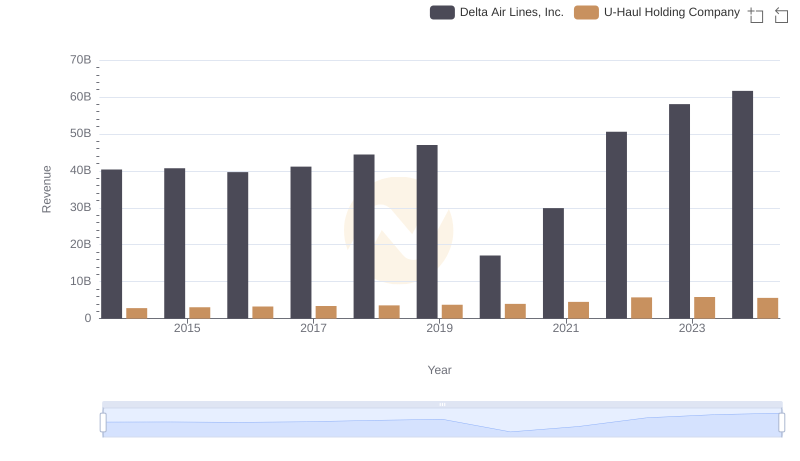
Delta Air Lines, Inc. vs U-Haul Holding Company: Examining Key Revenue Metrics
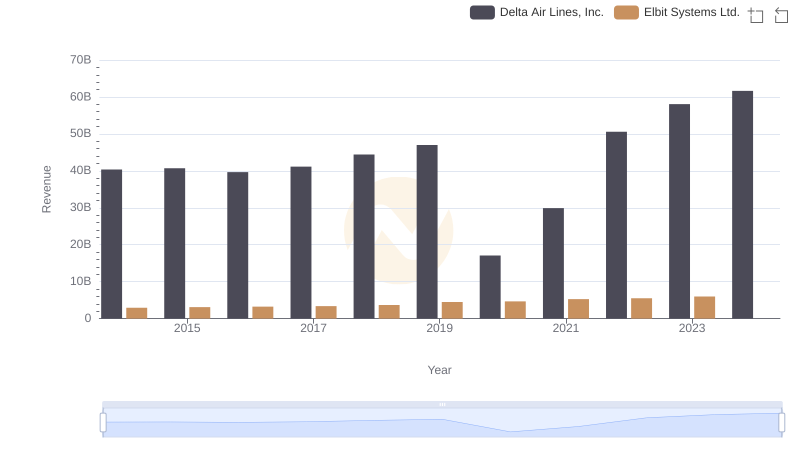
Revenue Showdown: Delta Air Lines, Inc. vs Elbit Systems Ltd.
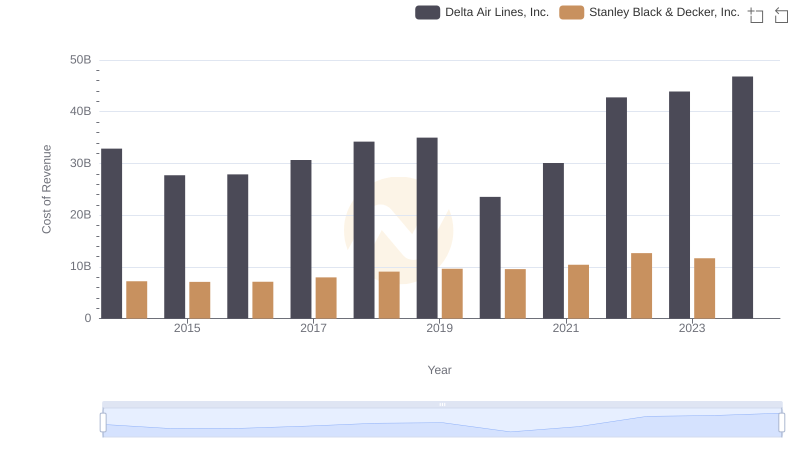
Cost of Revenue Comparison: Delta Air Lines, Inc. vs Stanley Black & Decker, Inc.
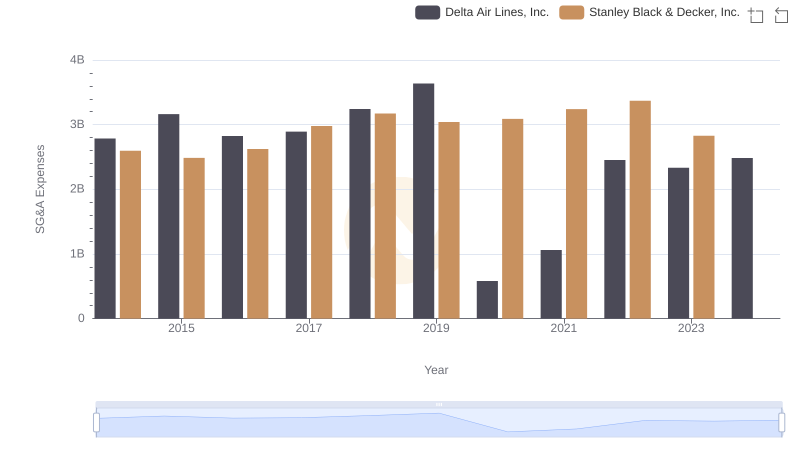
Selling, General, and Administrative Costs: Delta Air Lines, Inc. vs Stanley Black & Decker, Inc.